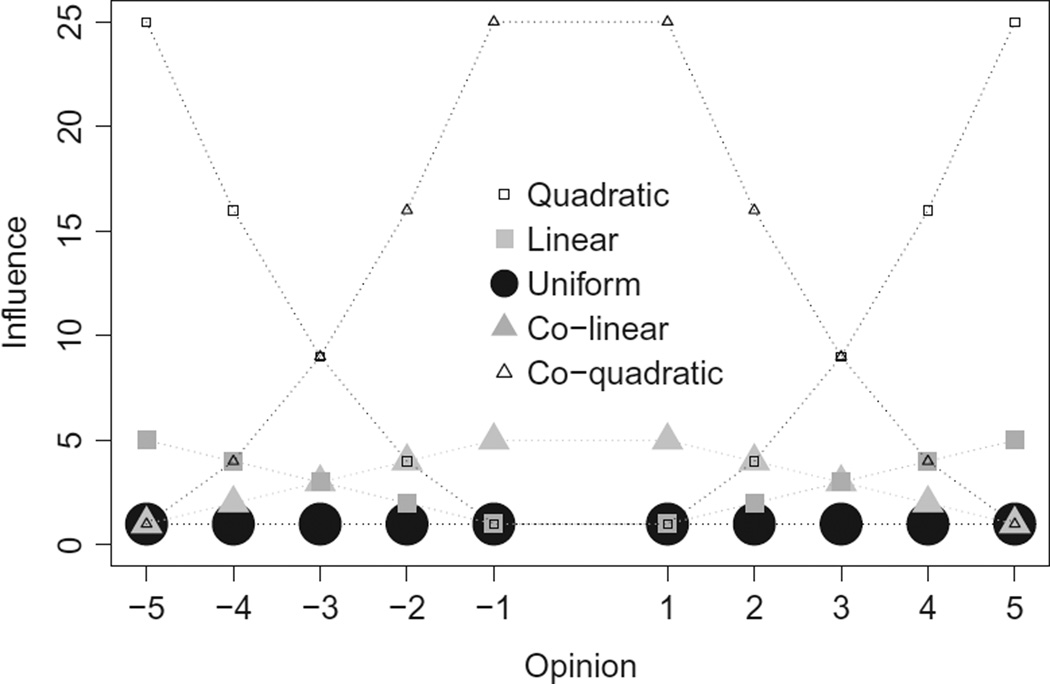
Figure 1.
Plot of the five influence functions we consider, shown here for L = 5. For the linear and quadratic influence functions, influence increases with the absolute value of the opinion. For the co-linear and co-quadratic influence functions, influence increases for more moderate opinions. Note that influence functions are only defined for integers. Connecting lines are provided as guides for the eye.

