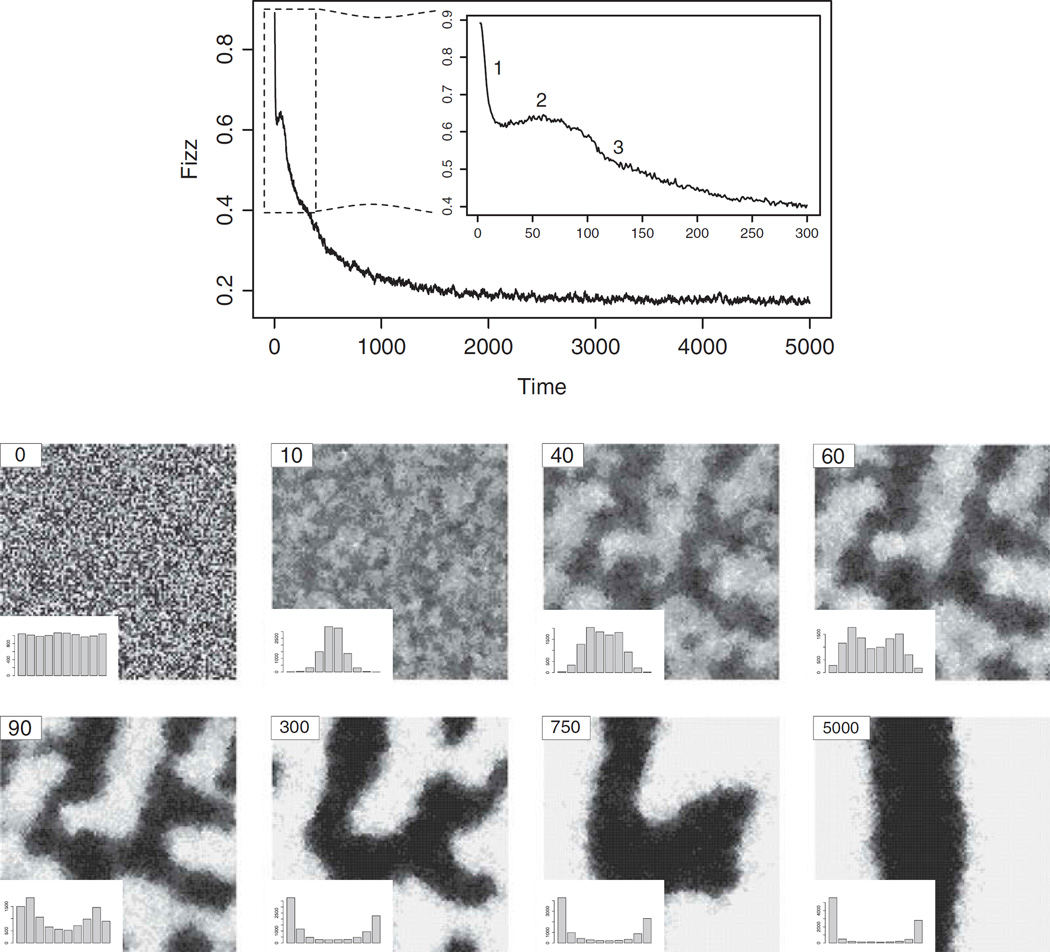
Figure 4.
Snapshots of a simulation on a 101×101 grid, with low amplification (pa = .07) and uniform influence. Inserts in the bottom left corners show the distribution of attitudes between −5 and 5 at the respective times, indicated in the top left corners. The time plot tracks fizz, the fraction of sites where an attitude has changed. Notice the relationship between the distribution of attitudes, spatial patterns, and fizz. The simulation begins with a uniform distribution of attitudes. Within 40 time steps there is significant clustering and boundary formation. The first period of high but rapidly decreasing activity (indicated by “1” in the time plot) is followed by a brief period where fizz increases slightly (see “2”; this corresponds to a widening of attitude distribution from a more centered distribution). Spatially, we observe the smoothing and sharpening of boundaries. This next period leads into a more gradual decrease in fizz (see “3”) and the contraction of boundaries via motion by mean curvature. These three periods correspond to changes in the frequencies of attitudes, where we first observe centering, and then a gradual increase in polarization.

