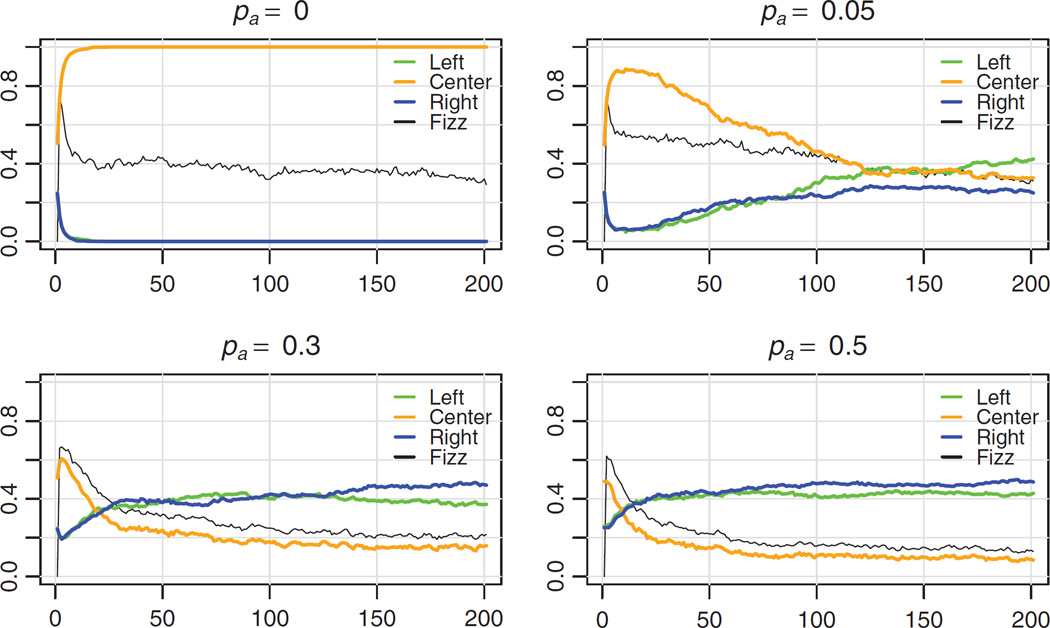
Figure 6.
Temporal plots of the frequencies of left (green), right (blue), and center (orange), along with fizz, for different values of amplification probability (pa) when the influence function is uniform. The top left figure indicates rapid centering of attitudes. In the top right figure, equal frequencies of the four attitudes is reached around 80 time steps; following this point, the attitudes on the left and right begin to dominate, with the left being more prominent. In the two bottom figures, polarization emerges. (Note that because center includes both −1 and 1, an equal distribution would have center at 0.5 and left and right at 0.25, as seen at time 0.) Notice that some centering occurs in each plot, except when pa = 0.5. The case where pa = 0.05 is similar to the case depicted in Figure 4, where there is an initial trend to the center of the attitude spectrum before polarization emerges. In general, as amplification increases, we see a decrease in the height of centering (orange) and the time spent in it.

