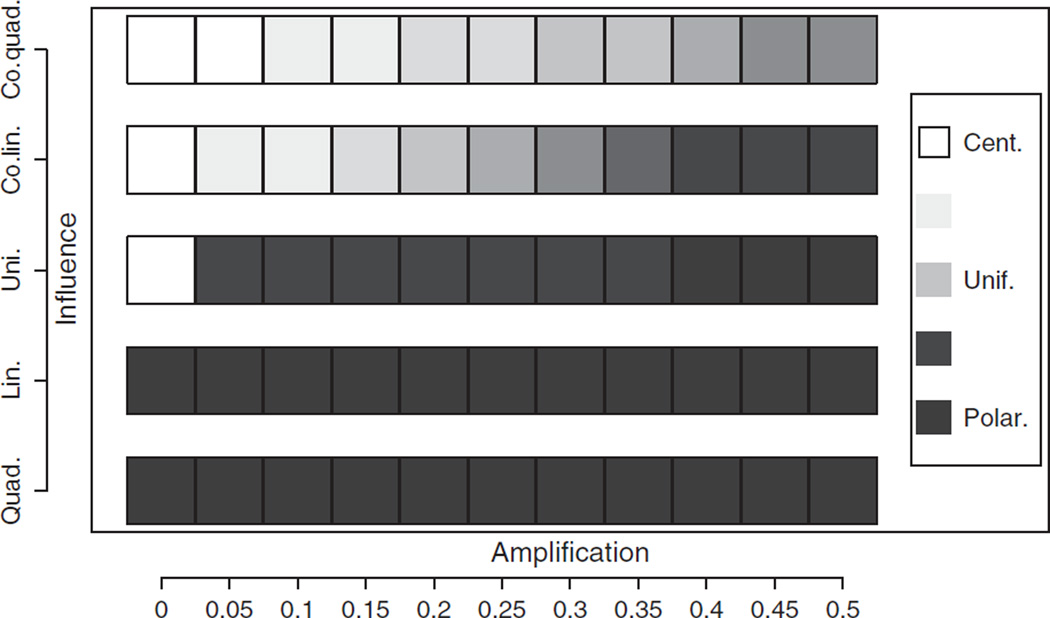
Figure 8.
Effects of combining influence functions with different amplification levels. Notice that each can independently affect the behavior of the system. Even when amplification is zero, a linear influence function produces polarization. Likewise, a small amount of amplification under uniform influence produces polarization. Co-linear influence and co-quadratic influence can help offset the polarization effects of amplification, but only follower levels of amplification. The behaviors are measured by taking the average difference between the frequency of center and the frequency of left or right, whichever is higher. Simulations were carried out for 200 steps.

