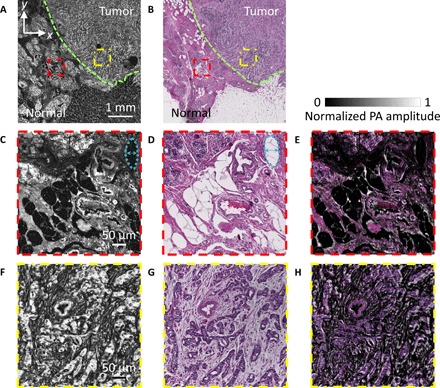
Fig. 2. Imaging of thin breast tissue slices without and with H&E staining.

(A) Unstained paraffin-embedded breast tissue slice imaged by the UV-PAM system. (B) H&E-stained deparaffinized breast tissue slice imaged by a standard microscope. The green dashed lines in (A) and (B) outline the boundaries of the normal and tumor regions. The upper-right area is the tumor region, and the bottom-left area is the normal region. (C and D) Zoomed-in UV-PAM and H&E-stained images of the normal regions (red dashed regions) in (A) and (B), respectively. The blue dashed lines and arrows on the top right-hand corners in (C) and (D) label a representative local deformation. (E) Overlay image of (D) on (C). (F and G) Zoomed-in UV-PAM and H&E-stained images of the tumor regions (yellow dashed regions) in (A) and (B), respectively. (H) Overlay image of (G) on (F).
