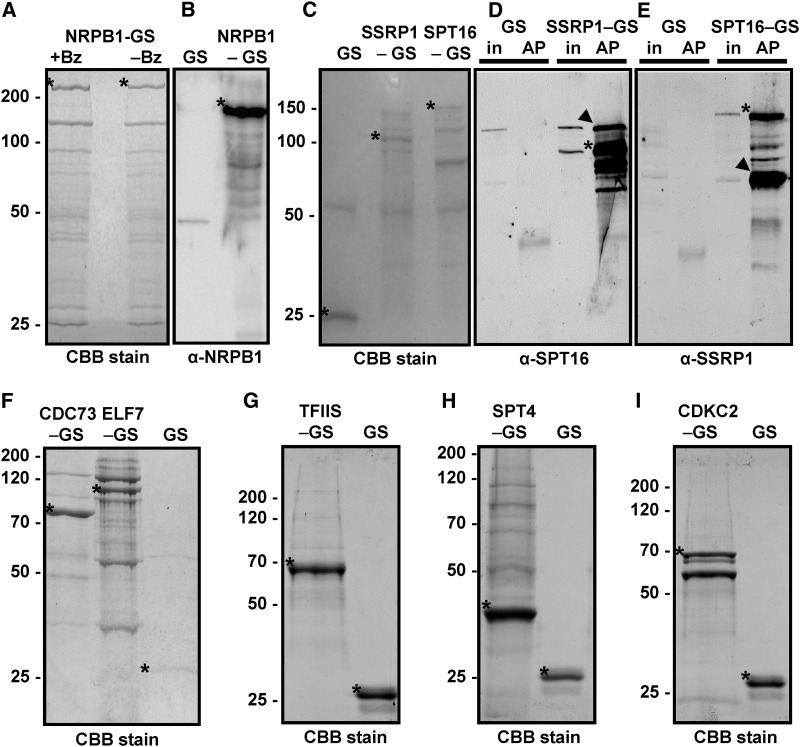
Figure 1.
Isolation of Components of the Transcript Elongation Complex.
The indicated GS fusion proteins were purified from Arabidopsis cells by IgG affinity chromatography from protein extracts treated with the nuclease benzonase (except right lane in [A]) to degrade DNA and RNA. Isolated proteins were separated by SDS-PAGE and stained with Coomassie Brilliant Blue (CBB) followed by mass spectrometric analyses or used for immunoblotting with the indicated antibodies. The unfused GS tag (GS) served as the control in these experiments.
(A) Eluates of the NRPB1-GS affinity purification with (+Bz) and without (−Bz) benzonase treatment.
(B) Detection of NRPB1 in the NRPB1-GS sample, but not in the GS control, by immunoblotting using an NRPB1 antibody.
(C) to (E) Analysis of the FACT subunits SSRP1-GS and SPT16-GS. Arrowheads indicate the efficient copurification of SPT16 with SSRP1-GS (in [D]) and of SSRP1 with SPT16-GS (in [E]). In addition to the specific bands that react with the respective primary antibodies, the bands of the GS fusion proteins are detected due to the affinity of the antibodies toward the protein G moiety of the tag. The bands are also detected in the input samples (in) but not in the GS control affinity purifications (AP).
(F) to (I) Analysis of PAF1-C (CDC73-GS and ELF7-GS), GS-TFIIS, SPT4-GS, and CDKC;2-GS. Asterisks indicate the different GS fusion proteins (that migrate in the gels according to their expected masses) and the unfused GS.

