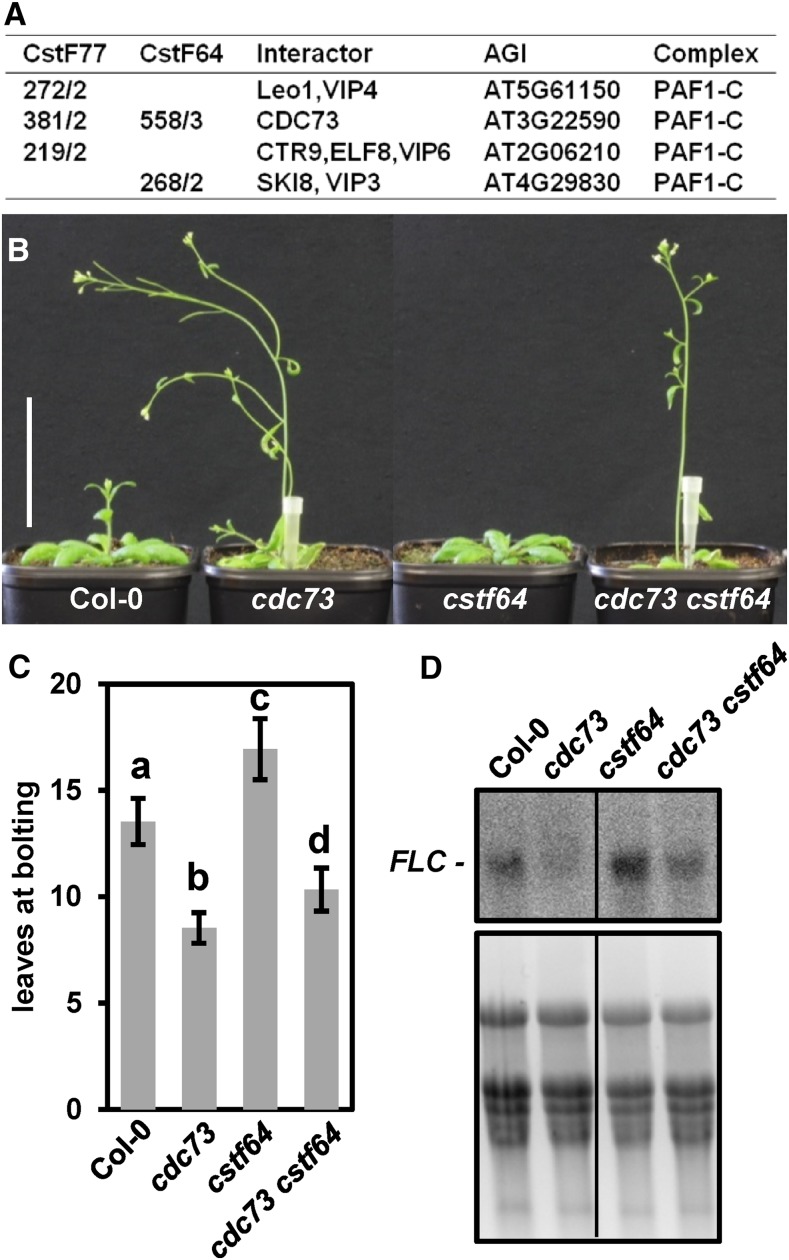
Figure 5.
Interaction of PAF1-C and the CstF Complex.
(A) Copurification of PAF1-C subunits with CstF77-GS and CstF64-GS. In the first two columns, the average Mascot scores are given as well as the number of times the interactor was detected in three independent affinity purifications.
(B) Representative images of the cdc73 cstf64 double mutant as well as the respective single mutants and Col-0 at 35 DAS under long-day conditions are shown. Bar = 5 cm.
(C) Quantification of the number of leaves at bolting (n = 15). Data were analyzed by two-way ANOVA (significance level P < 0.05) and error bars depict sd calculated from the measurements of 15 individual plants for each line.
(D) RNA gel blot analysis of RNA isolated from the different genotypes using an antisense probe that detects the FLC sense transcript (top panel). For comparison, an ethidium bromide stain of the RNA in the agarose gel prior to membrane transfer is shown (bottom panel).

