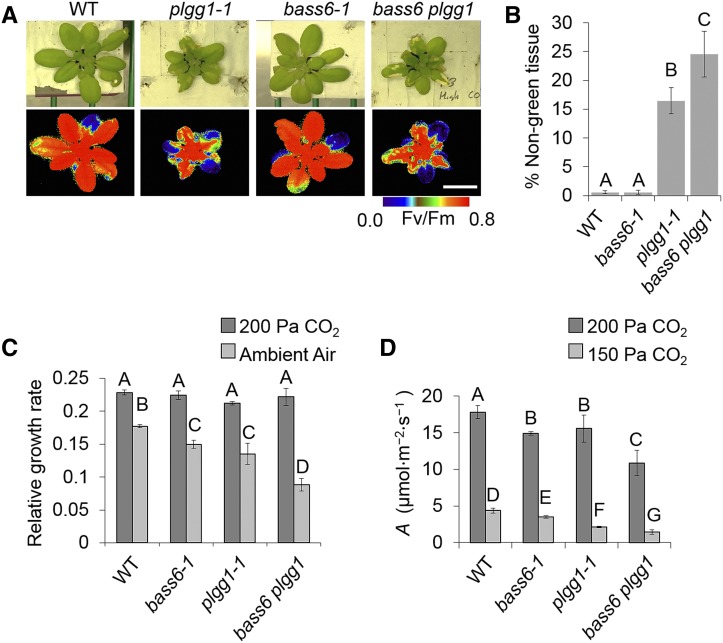
Figure 5.
The bass6 plgg1 Double Mutant Has a More Severe Photorespiratory Phenotype.
(A) Images represent indicated plants grown for 4 weeks at 200 Pa CO2 then shifted to ambient CO2 for 5 d. Fv/Fm images show changes in chlorophyll fluorescence due to the formation of chlorotic lesions on leaves. Images are representative of five replicates. Bar = 1 cm.
(B) Extent of chlorotic lesion formation. Percent nongreen tissue based on pixel density measured using photo software (Adobe) comparing nongreen tissue to total rosette tissue.
(C) Relative growth rate of indicated Arabidopsis T-DNA lines under either 200 Pa (dark) or ambient air (light) gray bars. Error bars indicate sd of at least five plants per each of three biological replicates. Letters indicate significant difference between CO2 treatments. Statistical difference based on ANOVA analysis (P < 0.05; Supplemental File 1).
(D) Photosynthetic measurements recorded at indicated CO2 concentration and saturating light (1000 μmol m−2 s−1) for the indicated strains. Letters represent significant difference from ANOVA analysis and Tukey’s post-hoc test. Error bars indicate sd.

