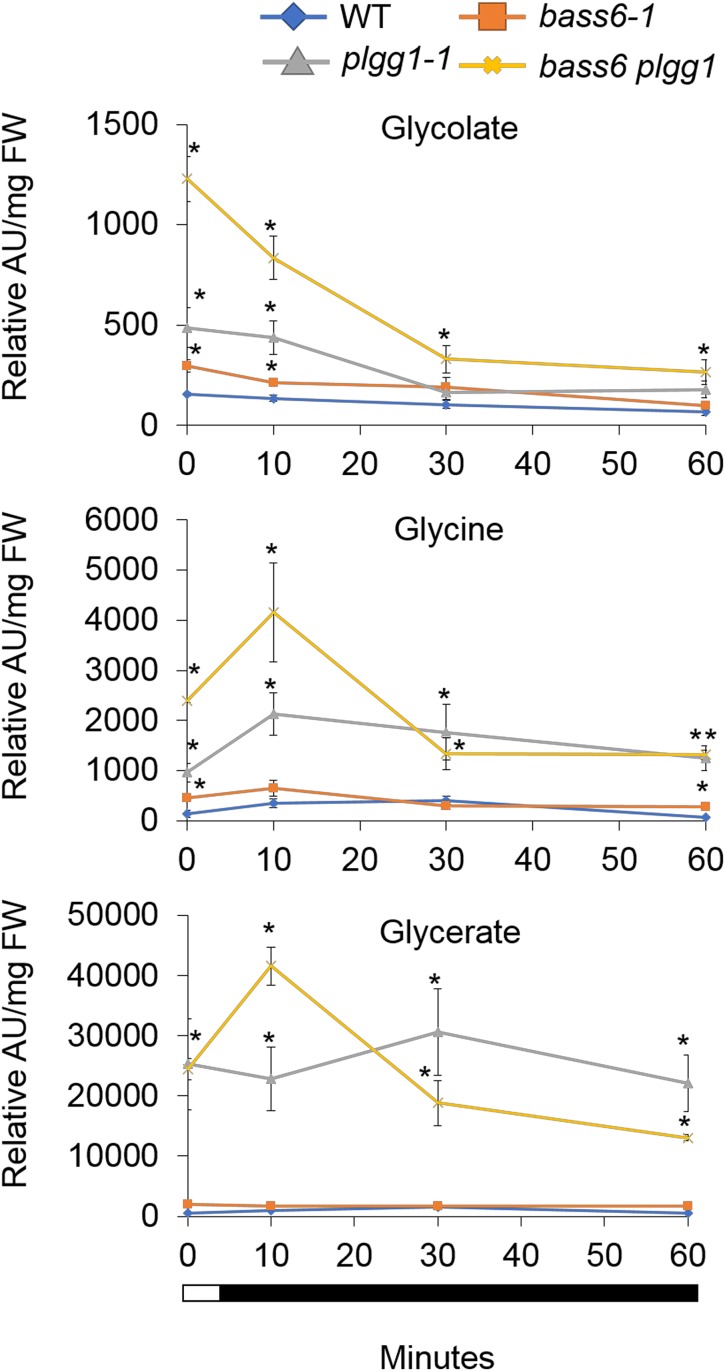
Figure 7.
BASS6 and PLGG1 Play a Role in Glycolate Metabolism.
Time course of metabolite levels in wild-type and mutant plants. The plant lines indicated were grown in elevated CO2 (200 Pa) for 4 weeks then shifted to ambient air (40 Pa CO2) for 24 h. At the end of the 8-h light cycle, tissue was collected as time 0 min. Each subsequent time point represents sampling during the dark period. The y axis numbers represent relative differences based on an internal standard. Error bars indicate se of the mean. Asterisks indicate statistical differences based on ANOVA analysis comparing wild-type control to T-DNA lines (n = 3; Supplemental File 1).

