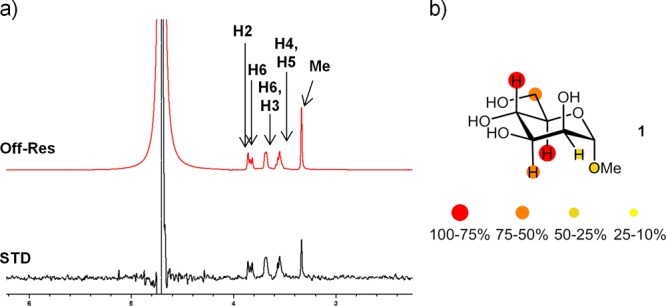
Figure 2.

(a) 1H NMR reference spectrum (off-resonance frequency 100 ppm) and STD spectrum (on-resonance frequency 0.6 ppm) of a sample containing 0.9 mM of ligand 1 and 30 μM of PSA at 25 °C (600 MHz). (b) Relative STD-AF (amplification factor) for H2–H6 protons is indicated by color code.
