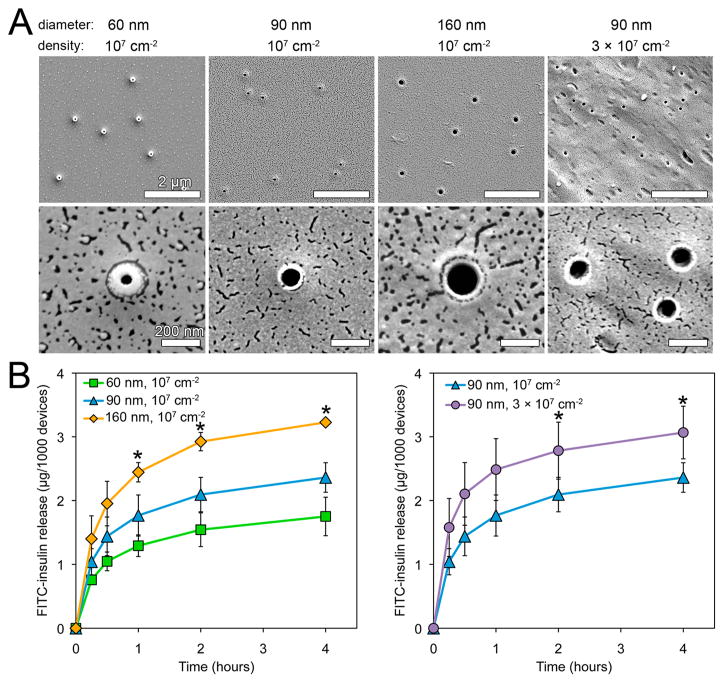
Figure 4.
Drug release rates scale with nanostraw diameter and density, allowing for tunable release. (A) SEM images of nanostraw membranes fabricated with varying nanostraw inner diameters (60, 90, 160 nm) and densities (1 × 10⁷, 3 × 107 cm−2). (B) FITC-insulin release from microdevices sealed with these membranes was monitored over time. Release rates scaled with both nanostraw diameter and density. *Indicates statistically different values between all samples at a given time point (p < 0.05).

