
Figure 4.
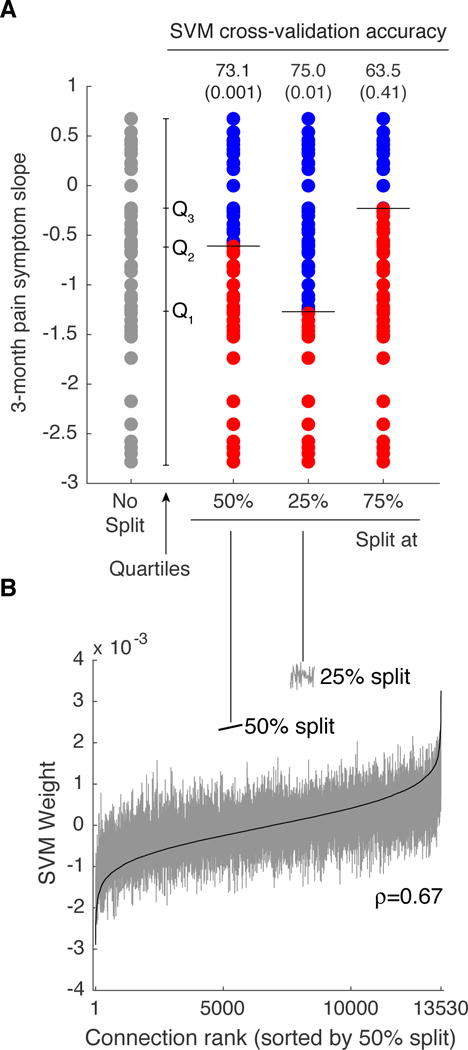
Analysis of SVM classification sensitivity to categorization of pain trends (slopes) into improvers and non-improvers. A. Original distribution of 3-month pain symptom trend (no split), as well as data split across the median (Q2), the 25th percentile (Q1) and the 75th percentile (Q3). Classification accuracy for the 25th percentile split increased to 75% (p=0.01), but decreased for the 75th percentile split to 63.5% (p=0.41). B. SVM weights ordered according to increasing value for the 50th percentile split (solid black line) largely retained the same ordering for the SVM trained on the 25th percentile split (Spearman rank correlation = 0.67).