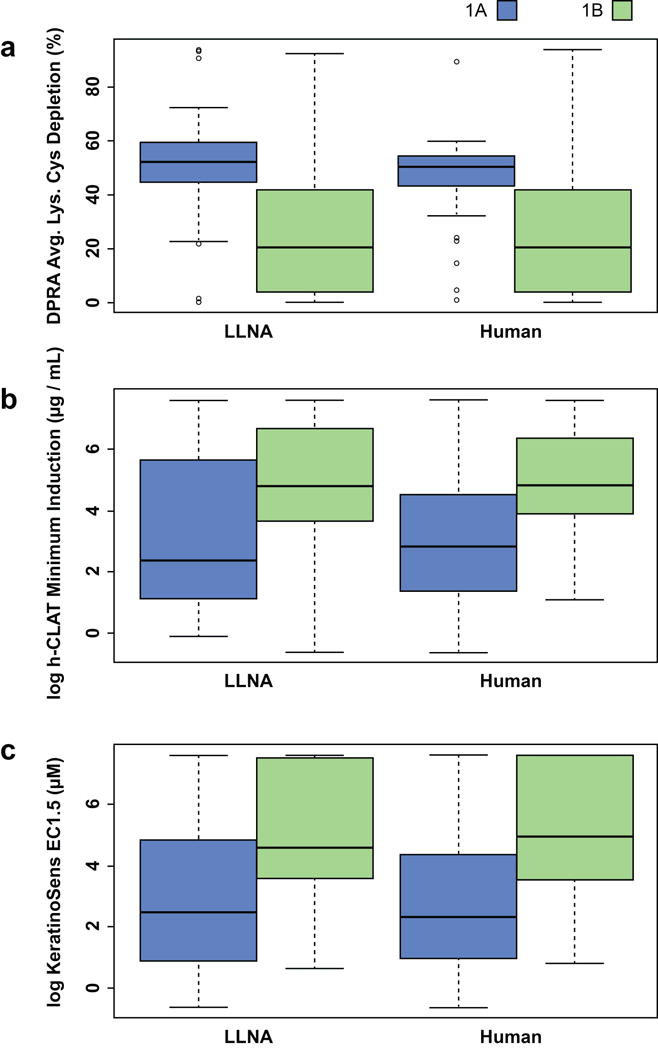
Figure 3.

Distributions of (a) DPRA, (b) h-CLAT and (c) KeratinoSens values for substances identified as GHS 1A and 1B sensitizers by LLNA and human data. The boxplot is graphed based on the data quartiles, which divide the distribution into the 25% (Q1), 50% (Q2) and 75% (Q3) percentiles. The height of the box is determined by Q1 and Q3 while the median or Q2 is represented by the dark line inside the box. Avg.Lys.Cys, average depletion of lysine and cysteine peptides; DPRA, direct peptide reactivity assay; EC1.5, concentration producing a 1.5-fold induction of luciferase activity; h-CLAT, human cell line activation test; GHS, Globally Harmonized System of Classification and Labeling of Chemicals (UN 2015); LLNA, murine local lymph node assay.
