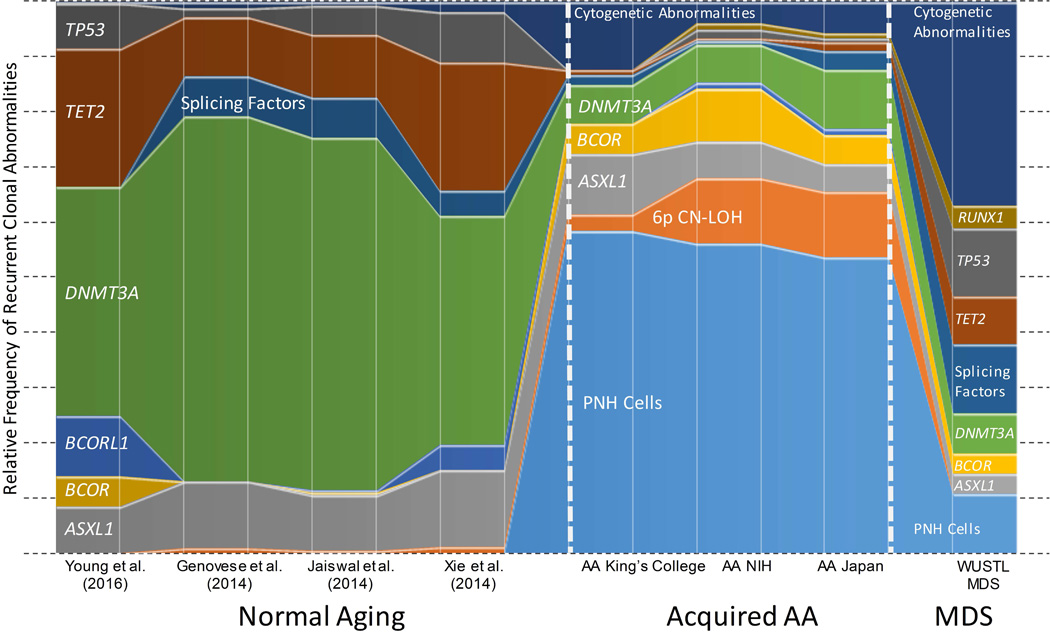
Figure 5. Clonal Signature of AA Compared to MDS and Normal Aging.
A schematic diagram comparing the relative frequencies of the most common clonal abnormalities found healthy individuals(Genovese, et al 2014, Jaiswal, et al 2014, Xie, et al 2014, Young, et al 2016), in three aplastic anaemia (AA)cohorts--King’s College (Kulasekararaj, et al 2014), National Institutes of Health (NIH) and Japan cohorts(Yoshizato, et al 2015), and in a myelodysplastic syndrome (MDS) cohort (Washington University in St. Louis, WUSTL) (Graubert, et al 2012, Walter, et al 2013). The prevalence of PNH cells in the healthy individuals and patients with MDS is depicted based on the published high-sensitivity PNH flow cytometry data in these populations (Kaiafa, et al 2008, Sutherland, et al 2012). The frequencies of cytogenetic abnormalities for healthy individuals are shown based on population-based studies of mosaic copy number abnormalities (Jacobs, et al 2012, Laurie, et al 2012). The prevalence of 6p copy number-neutral loss of heterozygosity (CN-LOH) in healthy individuals and in MDS is depicted based on a selection of studies (Jacobs, et al 2012, Laurie, et al 2012, Mohamedali, et al 2015).

