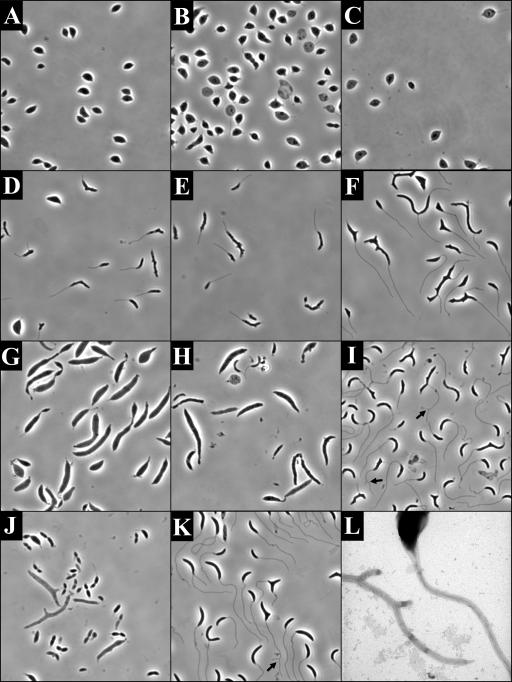
FIG. 6.
Morphology of cells recovering from MreB depletion (D to F and L), amdinocillin treatment (G to I), and RodA depletion (J and K). Images in panels A to K are phase micrographs taken at an original magnification of ×1,000. Panel L is a transmission electron micrograph taken at an original magnification of ×30,000. All cells underwent recovery in HIGG containing 5 μM phosphate. (A to C) Phenotypes of JG5008 after 9.5 (A), 19 (B), and 36 (C) h of depletion in HIGG-G. (D to F) Phenotypes of JG5008 grown in HIGG-G for 11.5 h of depletion and then recovered in HIGG-X for 2 (D), 11.5 (E), and 28.5 (F) h. (G to I) Recovery after amdinocillin treatment. Phenotype of cells after 10 h of growth in the presence of 12.5-μg/ml amdinocillin (G) with 16 (H) and 39 (I) h of recovery. (J and K) Morphology of YB363 grown for 24 h at room temperature in PYE-G (J) and shifted to HIGG-G for 36 h (K). (L) Transmission electron micrograph of branching stalk phenotype observed in JG5008 recovery (compare to panel F). Arrows in panels I and K indicate cells with obvious stalk forks.

