Figure 1.

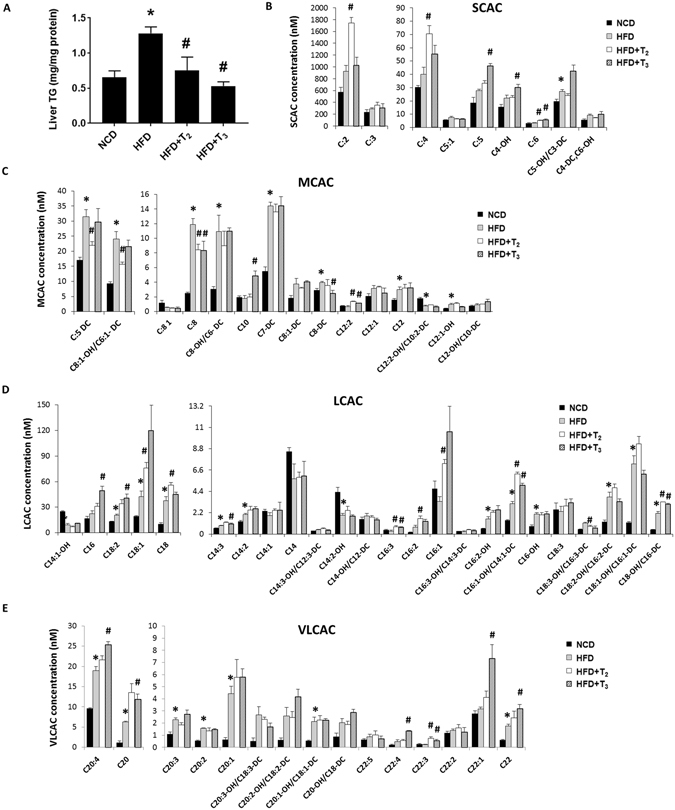
T2 and T3 reduce hepatic lipid accumulation in HFD fed rats associated with increased acylcarnitine flux. (A) Representative graph showing Triglycerides (TGs) content in rats liver treated respectively with NCD, HFD, HFD+T2, HFD+T3 for 1 week. Values are means ± SEM (n = 4). *P < 0.05 in NCD Vs HFD; #P < 0.05 in HFD Vs HFD+T2/HFD+T3. Metabolomics profiles of (B) short chain acylcarnitines (SCAC), (C) medium chain acylcarnitines (MCAC), (D) long chain acylcarnitines (LCAC) and (E) very long chain acylcarnitines (VLCAC) in NCD, HFD, HFD+T2 and HFD+T3 treated rats. Values are means ± SEM (n = 4). *P < 0.05 in NCD Vs HFD; #P < 0.05 in HFD Vs HFD+T2/HFD+T3.
