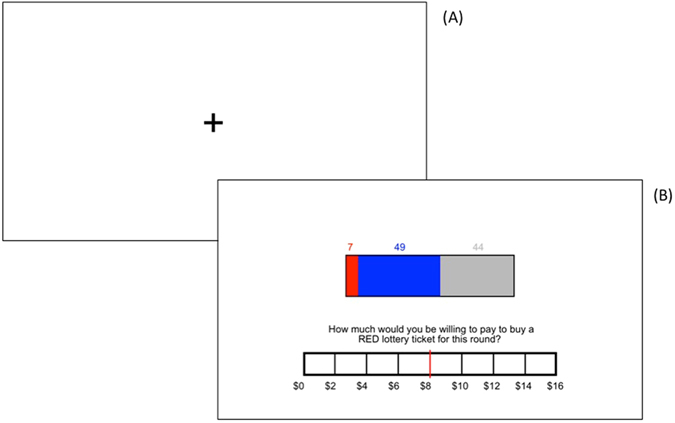
Figure 1.

Ambiguity Task Diagram. After a brief fixation period (A), participants were presented with a virtual “bag” of exactly 100 poker chips, all of which are colored either red or blue. On each trial, participants receive partial information about the number of red (winning) and blue (losing) chips. Participants were asked to indicate their willingness to pay (WTP) for a red ticket (B). In this sample trial, there are 7 red (winning) chips visible, 49 blue (losing) chips visible, and 44 chips that are not visible and thus not known to the participant. Participants selected a response to the question by moving a marker across the response bar.
