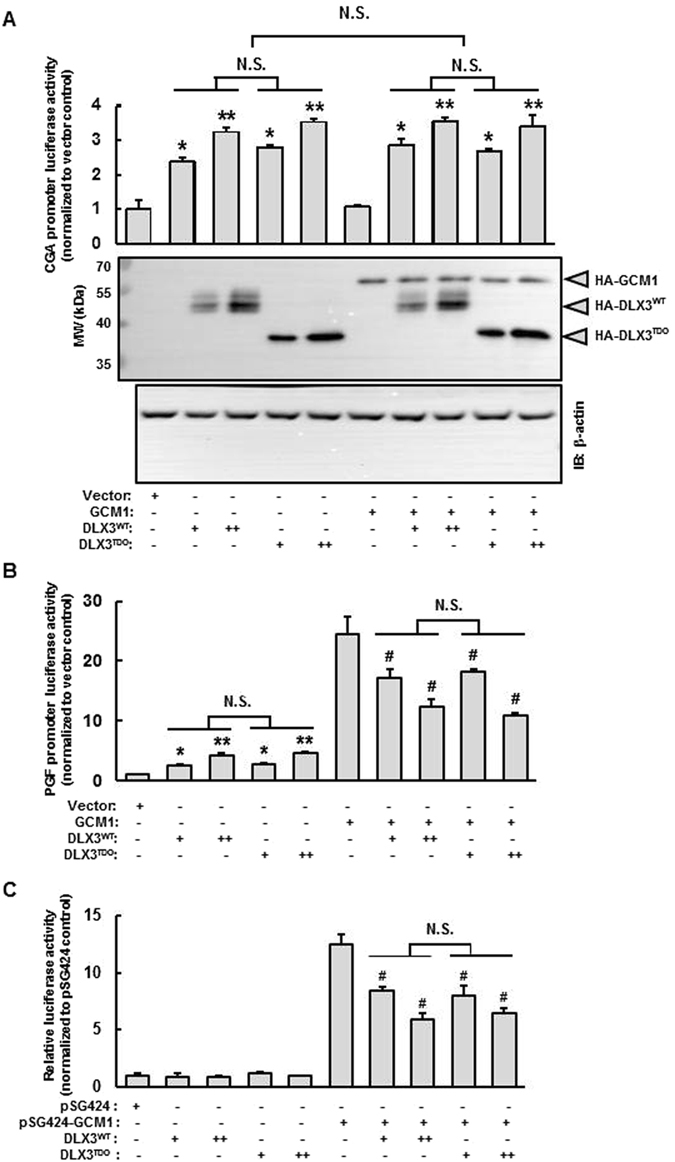
Figure 7.

The DLX3 TDO mutant displays similar transcriptional activity and inhibitory effects on GCM1 compared with DLX3WT. (A) The CGA promoter luciferase reporter assays were performed in JEG-3 cells transfected with CGA promoter luciferase reporter (0.2 µg), increasing doses of pKH3-DLX3 or pKH3-DLX3TDO (0.5 µg or 1 µg) for 48 h. Western blot analysis was performed to assess expression level of DLX3 variants and GCM1 (see gray arrowheads to the right of (A)) using HA immunoreactivity. This is a cropped image. See Supplementary Figure 3 for the uncropped image of this western blot. (B) The PGF promoter luciferase reporter assays were performed in JEG-3 cells transfected with PGF promoter luciferase reporter (0.2 µg) and increasing doses of pKH3-DLX3 or pKH3-DLX3TDO (0.5 µg or 1 µg), without or with pHA-GCM1 (0.5 µg) for 48 h. (C) Mammalian one hybrid assays were performed in JEG-3 cells transfected with increasing doses of pKH3-DLX3 or pKH3-DLX3TDO (0.5 µg or 1 µg) and pSG424-GCM1 (0.5 µg) together with pGL4.31 (0.5 µg; luciferase reporter) for 48 h followed by 10 μM MG-132 treatment for 6 h, and collected for luciferase assays. Luciferase activity is normalized to protein concentration and the vector control (A,B) or the pSG424 control (C). Results are reported as mean ± standard error (SEM) of triplicates from an individual representative of three independent experiments. Asterisks denote a statistically significant difference compared with the vector control (A,B), and # denote a statistically significant difference compared with GCM1 (B) or GAL4-GCM1 (pSG424-GCM1) (C). *P < 0.05, **P < 0.01, # P < 0.05, N.S.: non-significant differences by two-way ANOVA followed by the post-hoc Bonferroni test.
