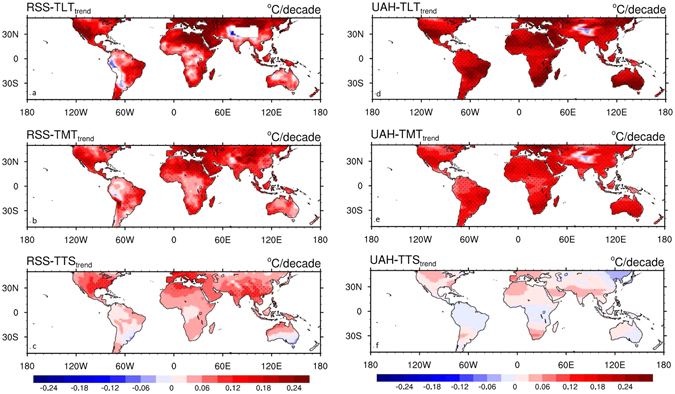
Figure 4.

Spatial patterns of annual temperature trends (°C/decade) from (a) RSS-TLT, (b) RSS-TMT, (c) RSS-TTS, (d) UAH-TLT, (e) UAH-TMT and (f) UAH-TTS for the period 1979–2015, in 2.5° × 2.5° grid boxes over land. Stippling indicates regions where temperature trends are statistically significant (p < 0.1). Map was created using the NCAR Command Language (Version 6.0.0) [Software]. (2011). Boulder, Colorado: UCAR/NCAR/CISL/TDD. http://dx.doi.org/10.5065/D6WD3XH5.
