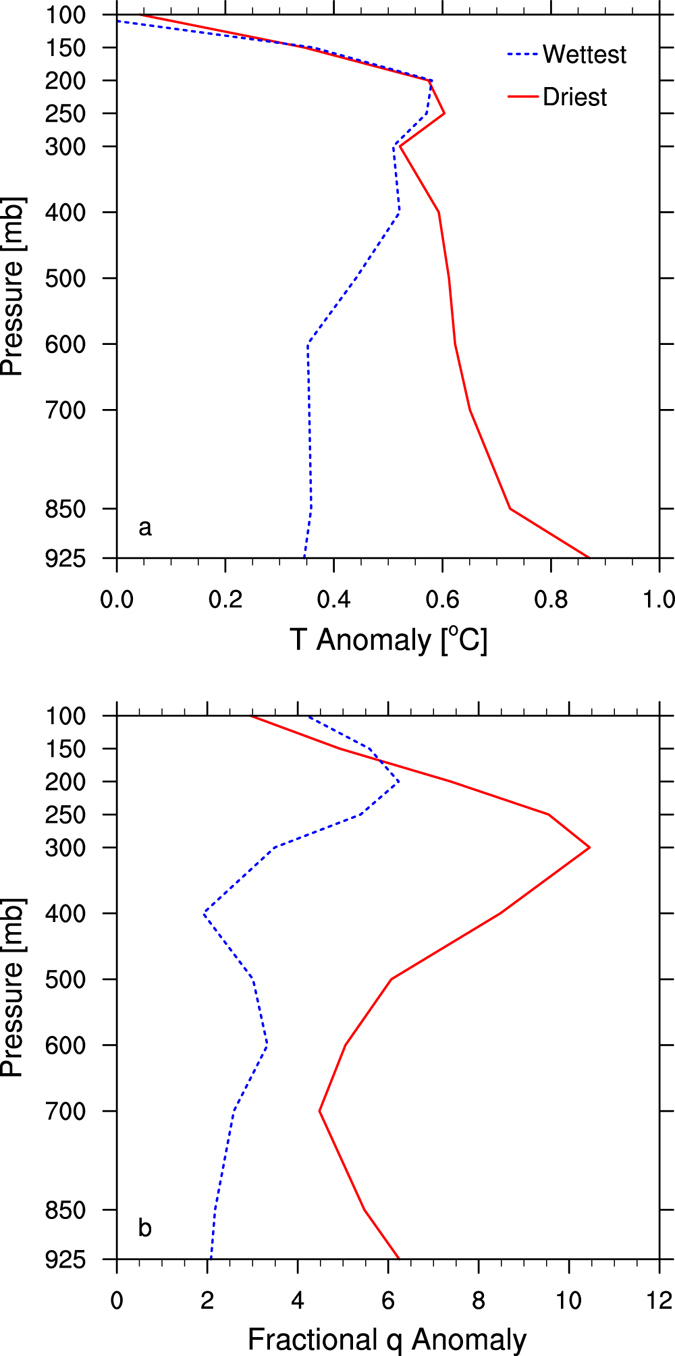
Figure 7.

Zonal mean annual anomalies in 2010 for (a) T (°C) and (b) q (%) as a function of pressure (mb) over the driest and wettest from the 12 large-scale climate zones classified by precipitation. The anomalies are calculated as the difference in the annual averages in 2010 and the climatology aggregated from other years (2003–2009 & 2011–2015). For the q plot, the anomaly is expressed as the percentage divided by the climatological q value.
