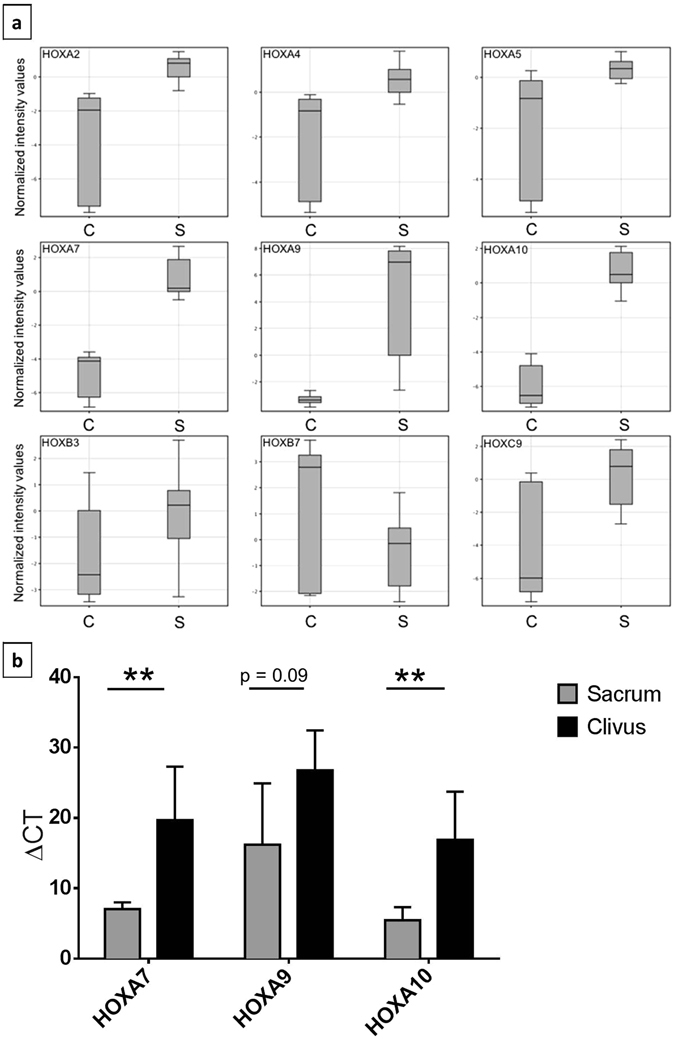
Figure 4.

Expression of several HOX gene family members. (a) Box plot illustration of the differences in the expression of HOXA2, -A4, -A5, -A7, -A9, -A10, -B3, -B7, and -C9 between clivus (c) and sacrum (S) chordoma cell lines. Measurements represent the results of microarray expression profiling of three clivus and nine sacrum chordoma cell lines (each cell line was tested at least in duplicates). (b) Validation of the expression of HOXA7, -A9 and -A10 in the chordoma cell lines via qPCR shown as measured ΔCT values. High ΔCT values represent lower expression of the corresponding gene. Measurements were performed in triplicates. Differences in expression were tested by t-tests. p < 0.05 was regarded as significant difference (*). **p < 0.01.
