
Figure 1.
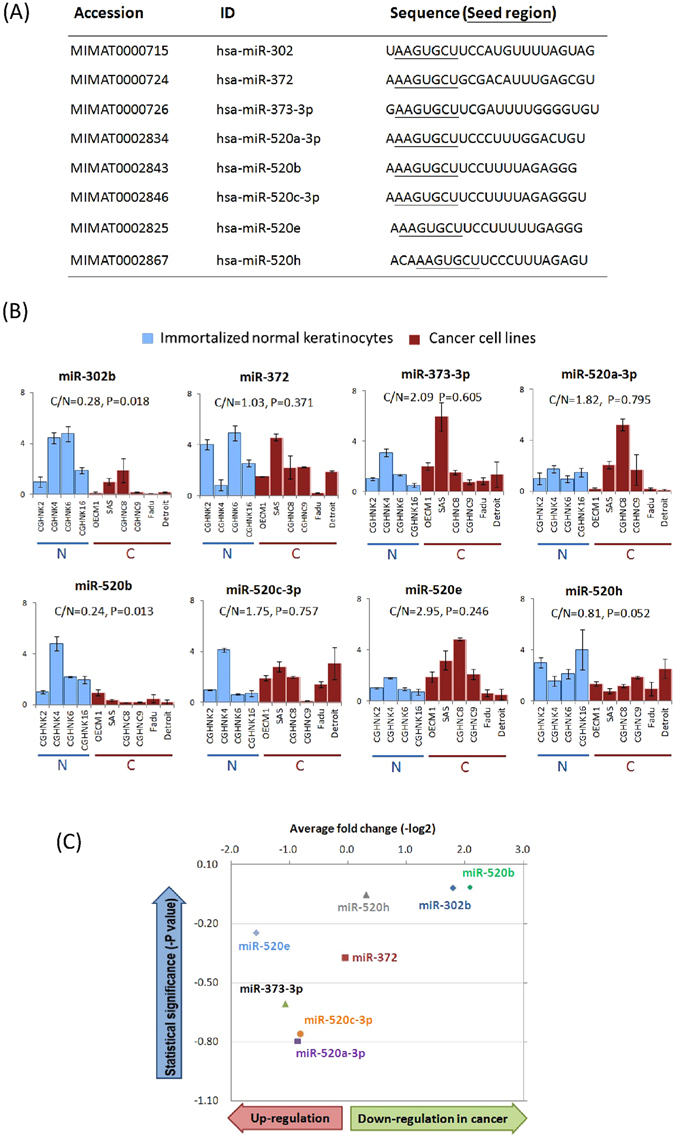
Differential expressions of miR-302/372/373/520 family members between normal keratinocytes and HNC cell lines. (A) The miR-302/372/373/520 family members are listed along with the relevant accession number, ID and sequence. Seed regions, which are underlined within the sequence, are the same among all members. (B) The relative expression levels of miRNAs of the miR-302/372/373/520 family in HNC cancer cell lines and normal keratinocytes were determined by RT-qPCR. The expression levels as recorded by threshold cycle numbers (Ct) were normalized against an internal control (U6 RNA), and the comparative threshold cycle method (ΔCt) was used to determine the relative miRNA expression. (C) The overall view of the differential expression of 8 miRNAs between cancerous and normal samples, with the average fold change (X-axis) and statistical P value (Y-axis) for each miRNA (t-test).