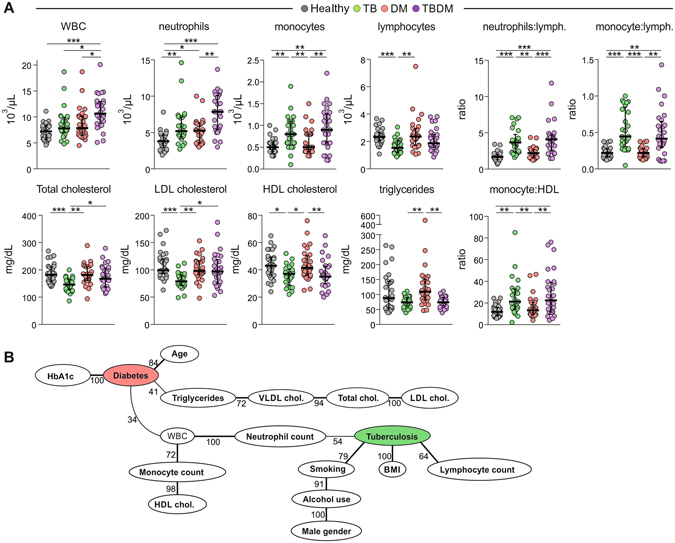
Figure 1.

Factors associated with TB and/or DM in the cohort. (A) Data represent median and interquartile ranges. The Kurskal Wallis test with Dunn’s multiple comparisons ad hoc test were employed to compare the values detected between the study subgroups. P-values for the Kruskal Wallis tests are shown in Appendix File S1. P-values were adjusted for multiple comparisons using Holm-Bonferroni’s approach as described in methods. Only comparisons with significant P-values after adjustments are displayed (*P < 0.05, **P < 0.01, ***P < 0.001). (B) Bayesian network with bootstrap (100x) was used to illustrate the statistically significant associations between the parameters and the presence of TB and/or DM in the study population. Lines represent direct associations. Associations that remained statistically significant on >30 times out of 100 bootstraps are plotted. Numbers of times each association persisted during bootstrap are shown. Bold lines highlight the strongest associations, which persisted more than 60 times in the bootstrap. Vitamin D is not presented in the picture, as it would be solitary node with no arcs attached.
