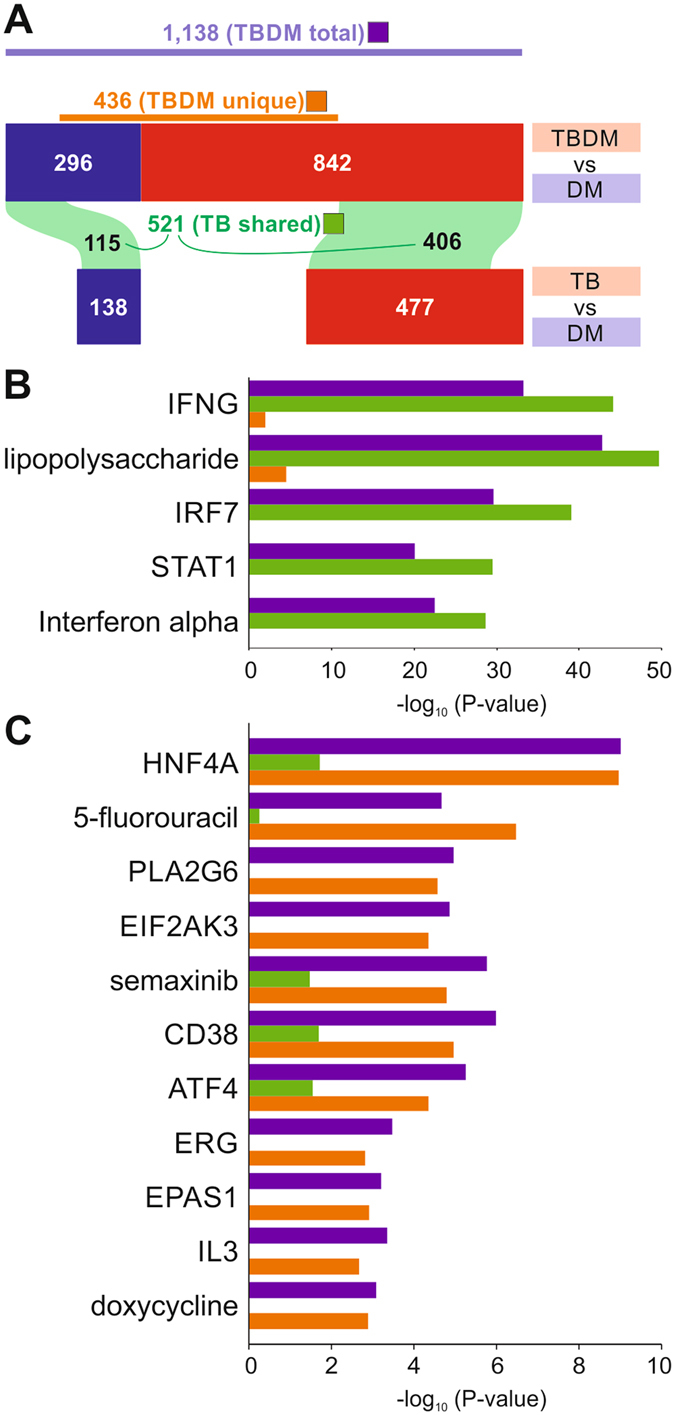
Figure 4.

Blood transcriptome of patients with dual TB and DM burden compared to TB or DM alone. (A) Differentially expressed genes between patients with distinct clinical phenotypes (class). The comparison between two classes is indicated at the top of each bar. Red and blue bars represent the number of DEGs which are up- or down-regulated, respectively in the first class of the comparison. The purple bar shows the number of DEGs in the comparison TBDM vs. DM (“TBDM total”). The number of DEGs which are in common to two comparisons are shown inside green areas connecting two horizontal bars (“TB shared”). Genes which are uniquely differentially expressed in TBDM vs. DM is shown by the brown bar (“TBDM unique”). (B) Top transcriptional regulators in “TB shared” DEGs. Ingenuity’s Upstream Regulator Analysis was performed using “TB shared” (green bars), “TBDM unique” (brown bars), and “TBDM total” DEGs (purple bars). The x-axis indicates the significance of the enrichment for the upstream regulators on the left. (C) Top transcriptional regulators in “TBDM unique” DEGs identified by the same approach as in (B).
