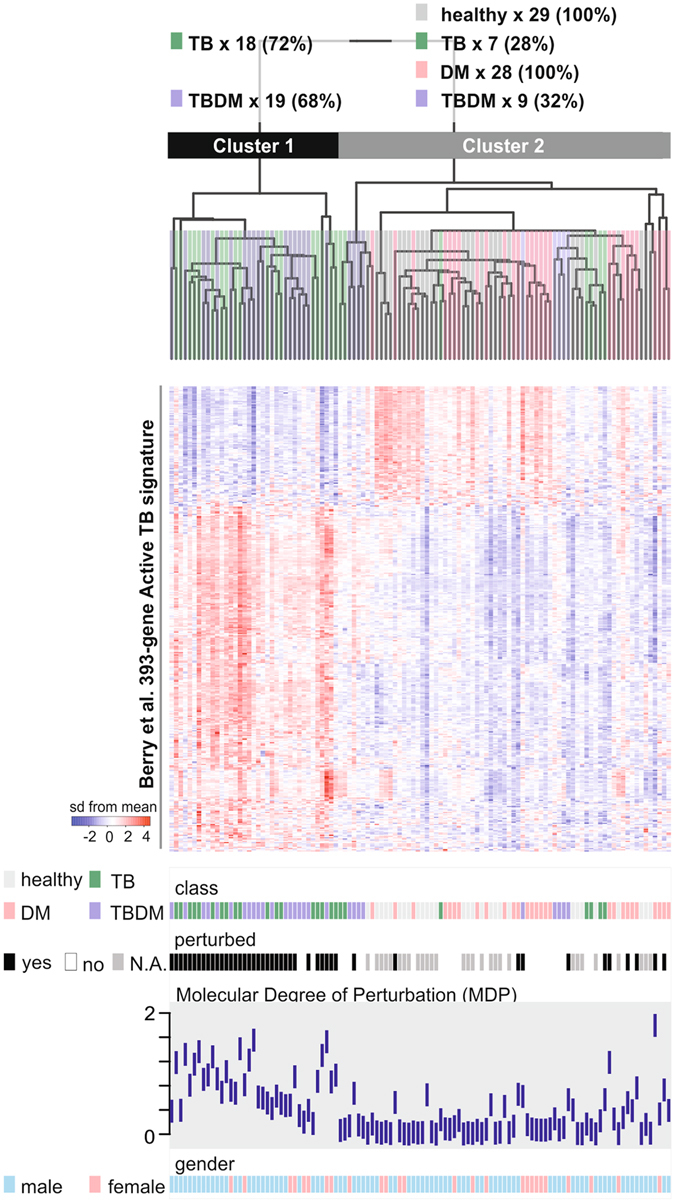
Figure 6.

A blood transcriptional signature of active TB classifies most patients with or without diabetes. We applied a previously defined 393-gene signature of active TB32 to the 387 genes represented in the microarrays used for the present study. Expression profile of each patient and health subject (column) was ordered by hierarchical clustering (Spearman correlation with average linkage). The condition tree at the top shows 2 main clusters. The number of individuals from all each clinical subgroup (class) who segregated into each cluster is indicated at the top of the figure. Colored blocks at each profile base represent the different classes, molecular perturbation status, MDP score and gender.
