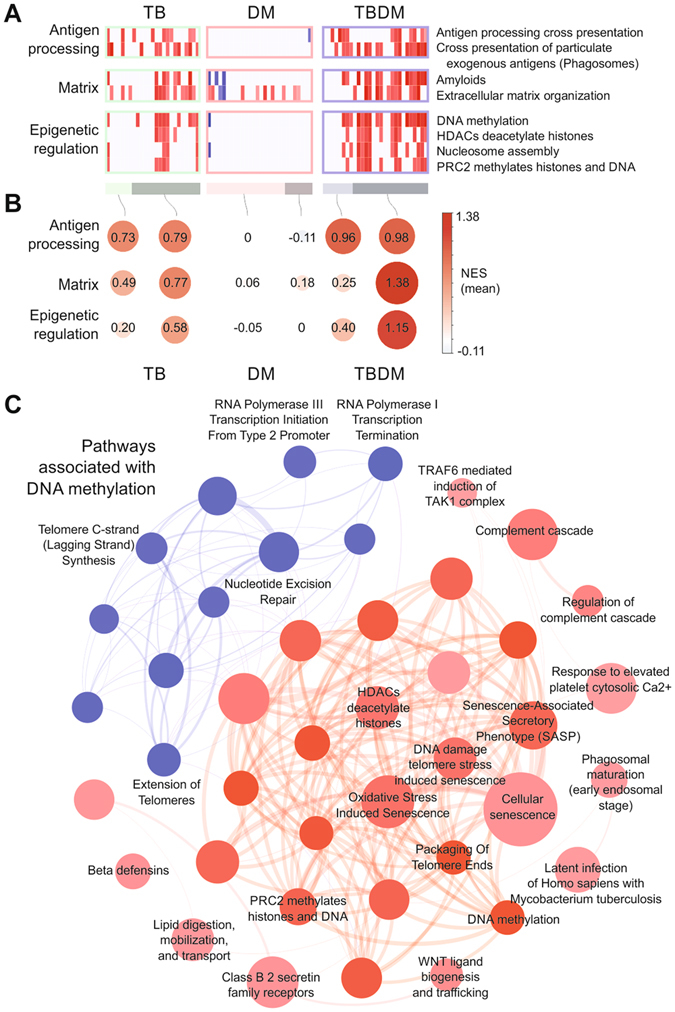
Figure 7.

Increased activity of pathways associated with epigenetic regulation in diabetic TB patients. (A) Single sample Gene Set Enrichment Analysis (ssGSEA) was performed for each patient using the genes ranked by their MDP score and Reactome pathways as gene sets (P < 0.01, 1,000 permutations). Colors represent increase (red) or decrease (blue) in pathway expression activity vs. healthy controls as given by the normalized enrichment score (NES). Bars at the bottom indicate patients which are perturbed (darker color) or not-perturbed (light color). (B) Mean NES (values inside the circles) of the patients and pathways for each functional group. The size of the circles is proportional to the mean NES and color indicates positive (red) or negative (blue). (C) Pathways associated with “DNA methylation”. Spearman correlation between the expression activity of “DNA methylation” pathway and all other Reactome pathways across all patients. The network shows the pathways with correlation >0.6 (red circles) or <−0.6 (blue circles). The thickness of the edges is proportional to the number of genes in common between two given pathways (nodes).
