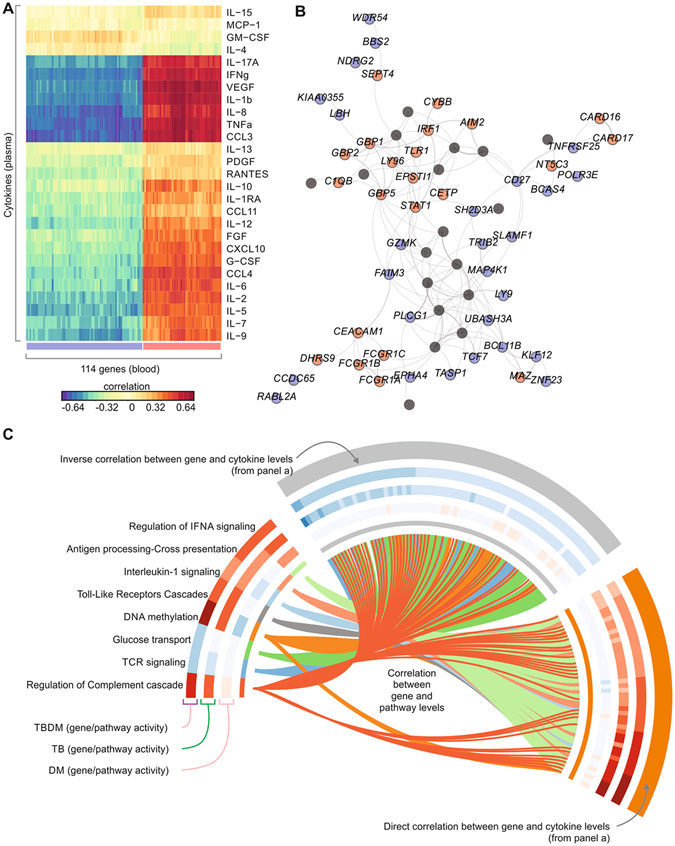
Figure 8.

Integrative analysis of cytokines, gene expression and pathway activity in TBDM. (A) Integration of cytokine levels and microarray gene expression. Sparse group partial least square methods were used to identify the genes whose expression best correlates with most of the cytokines. Colors represent the correlation values between the expression of genes in blood (columns) and the levels of cytokines in plasma (rows). (B) Network containing some of the 114 genes from (A) GeneMania program was used to define the interactions (edges) between genes (nodes), and Gephi program to visualize the network. Colors represent is positive (red) or negative (blue) correlation of gene expression with the cytokines. (C) Integration of gene expression and pathway activity. Circos plot shows 8 selected pathways and 114 genes from (A). Each pathway was assigned to one color (inner circle). The lines connecting pathways and genes represent a high correlation (spearman correlation above 0.6) between the activity of the pathway (defined by the single-sample enrichment score) and the gene expression. Heat maps shown in the outer circles represent the activity of pathways (mean Normalized Enrichment Score) and genes (mean log2 fold-change in patients compared to healthy subjects). Colors indicate increase (red) or decrease (blue) in pathway activity or gene expression fold-change.
