
Figure 5.
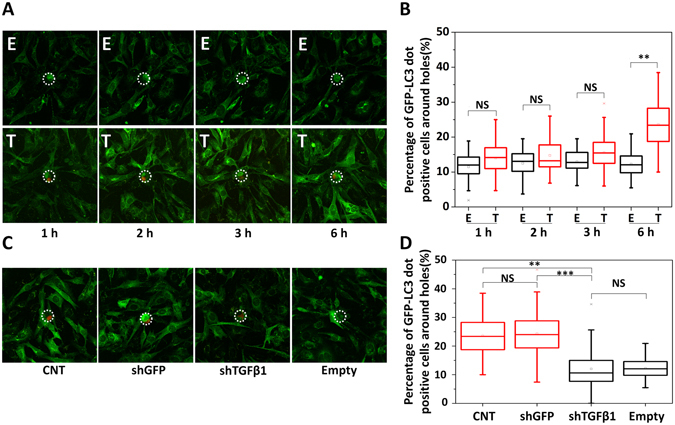
Single cell-level monitoring of autophagy in fibroblasts interacting with individual cancer cells. (A) Live cell images of dynamics of autophagy activation in fibroblasts that are near an empty hole (E) or a hole with a trapped single tumor cell (T). (B) Box plot representation of GFP-LC3 dot quantification of fibroblasts near an empty hole (E) or a hole with a tumor cell (T) (1 h, 2 h, 3 h and 6 h co-culture). After 6 h of intercellular interactions, autophagy near holes with trapped tumor cells (Number of holes = 68) could well be differentiated from those near empty holes (Number of holes = 65). (C) Images of autophagy activation in MEFs near a hole with a wild-type MDA cell (CNT) (Number of holes = 68), shGFP infected MDA cell (shGFP) (Number of holes = 89), shTGFβ1 infected MDA cell (shTGFβ1) (Number of holes = 84) and empty holes (Number of holes = 65). (D) Quantification of autophagy activation in MEFs shown in C. MEFs near shTGFβ1 infected MDA cells (shTGFβ1) had lower autophagy levels (comparable to empty holes (Empty)) compared to those near wild-type (CNT) or shGFP infected MDA cells (shGFP). Images were analyzed by Imaris software (3 independent experiments, p-value was calculated by results of each set, NS: Non-significant, **p < 0.01, ***p < 0.001).