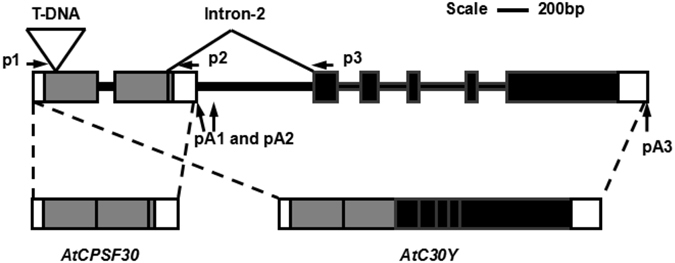
Figure 1.

The structure of the OXT6 gene and RNA transcripts. Exons are indicated in gray or black boxes, UTRs are indicated in white boxes, and introns are indicated in thick lines. The position of the T-DNA insertion in the oxt6 mutant is indicated above Exon-1. The polyadenylation regions inside Intron-2 (pA1 and pA2) and 3′ UTR (pA3) are indicated with arrows. Positions of primers used for quantitative RT-PCR are labeled above the OXT6 gene. Primers p1 and p2 are used to detect AtCPSF30 transcript, while primers p1 and p3 are used to detect AtC30Y transcript. This figure is adapted from14 with modifications.
