
Figure 3.
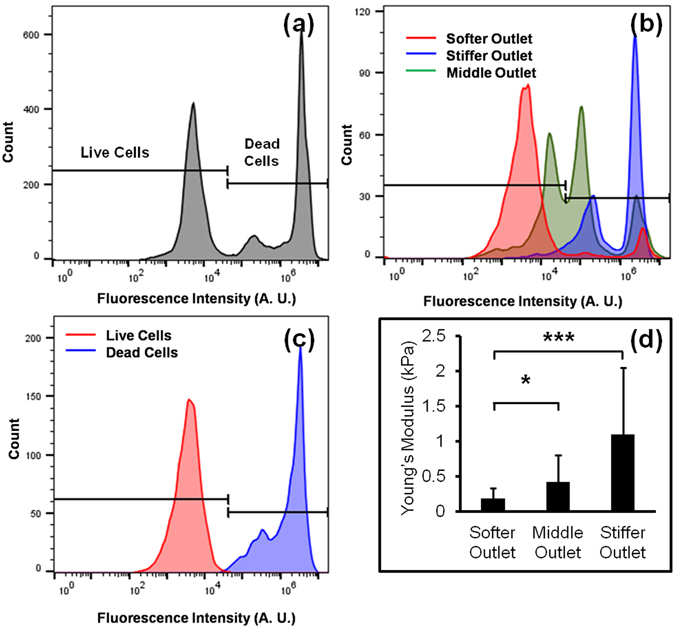
Flow cytometry analysis of the EthD-1 stained cells (a) cells in inlet; (b) cells collected from three different outlets of the device. The number of live and dead cells was calculated by comparing the results with control experiments; (c) flow cytometry data of control live and dead cells stained with Ethd-1 which is used to determine the threshold level to distinguish live and dead cells; (d) average Young’s modulus of sorted cells collected from three outlets (N = 20, *p-value < 0.01, and ***p-value < 0.001).