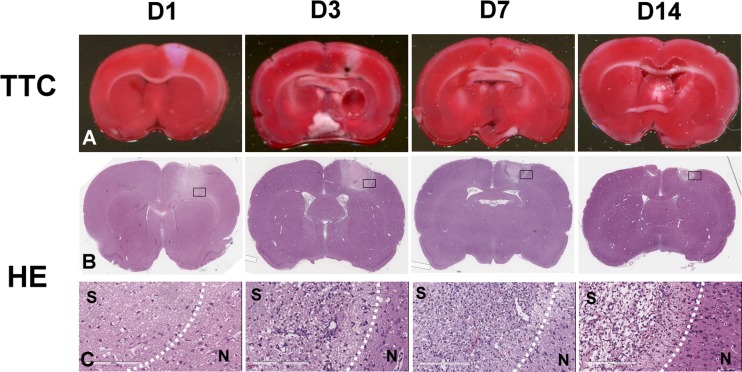
Fig. 2.
Longitudinal TTC and H&E staining at day 1, 3, 7, and 14 after induction of photochemical thrombosis. TTC-negative area, observed at the site where laser illuminated, was largest in size at day 1, then decreased with time, and was almost not detectable at day 14 (a). b–c Morphological change in H&E-stained tissue sections. It showed a typical stroke-induced liquefactive necrosis at day 1, dilated vessels at day 3, infiltration of cells into the surrounding area of ischemia at days 3 and 7, and neovascular formation at day 14

