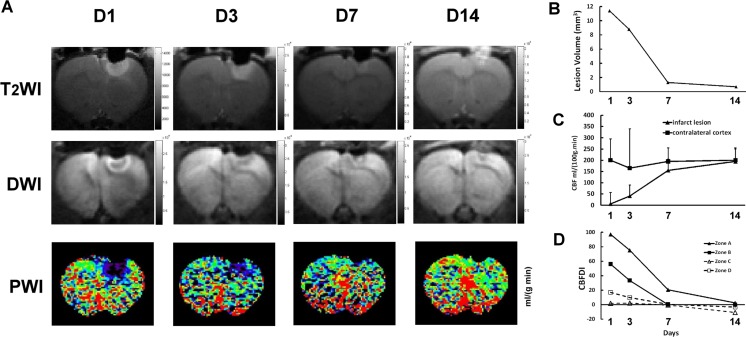
Fig. 5.
Sequential images of T2WI, DWI, and PWI in stroke lesion on the right somatosensory cortex and CBF analysis. a Images of T2WI, DWI, and PWI at day 1, 3, 7, and 14 after ischemia induction demonstrated the evolution of vasogenic edema and cytotoxic edema with time. b Evolutional changes and CBFDI, which was calculated from the regional CBF obtained from the PWI of the infarct lesion (zone A), peri-lesional region (zone B, one-pixel width surrounding the infarct lesion), ipsilateral remote cortex (zone C), and hippocampus (zone D). It suggests that CBF of zone B improved more significantly than that of zone A from day 7 after induction

