FIGURE 3.

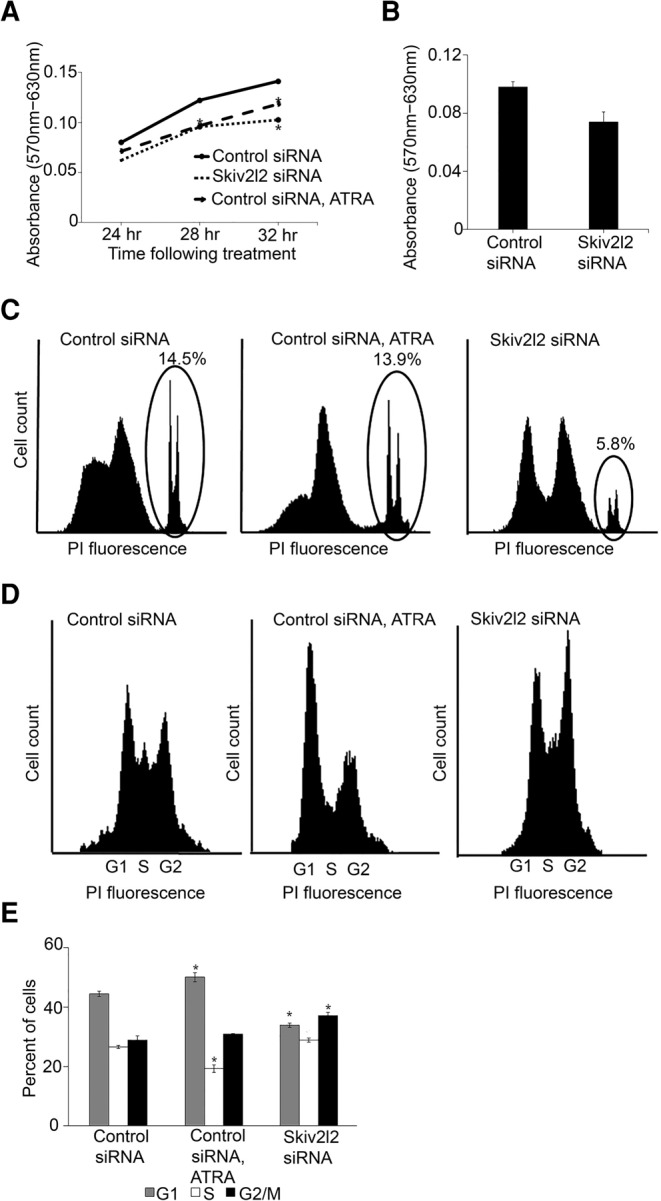
Skiv2l2 knockdown results in delayed proliferation attributed to slowed G2/M phase progression. (A) MTT time point assay in N2A cells. Absorbance of formazan (570 nm) at 24, 28, and 32 h following treatment with control siRNA, ATRA, or Skiv2l2 siRNA (n = 4 for each time point, [*] represents P-value <0.05). (B) MTT assay in P19 cells. Absorbance of formazan was measured after 48 h of treatment with control siRNA, ATRA, or Skiv2l2 siRNA (error bars represent ±SD for n = 9). (C) Propidium iodide viability staining of N2A cells. Fluorescing cells (dead or necrotic) detected by the FL-2 filter are circled, and the Accuri C6 software was used to quantify the percentage of control, ATRA treated, and Skiv2l2 knockdown cells staining with propidium iodide. (D) Cell-cycle analysis with propidium iodide staining of fixed N2A cells. Cells treated with control siRNA, Skiv2l2 siRNA, or ATRA were excited at 488 nm and sorted using FL-2 on the Accuri C6 based on propidium iodide fluorescence. The sorted cells corresponded to G1, S, and G2/M phase as denoted. (E) Quantification of cell-cycle profile. Based on the cell-cycle landscapes generated in D, the Accuri C6 software was used to calculate the percentage of cells in G1, S, and G2/M phase, where n = 3 sets of 50,000 cells and statistically significant differences (P-value <0.05) are denoted with an asterisk (*).
