Figure 1.
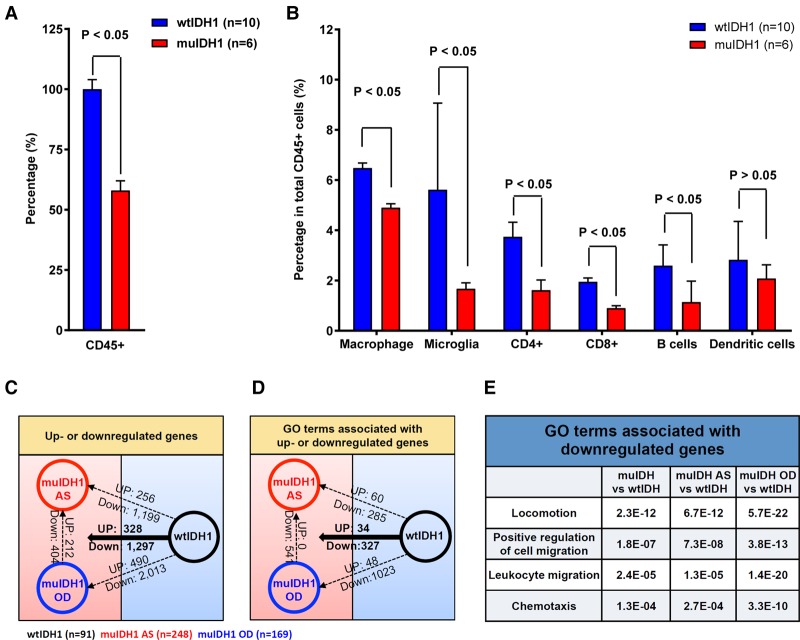
Human muIDH1 gliomas had repressed tumor-associated immune systems. (A,B) FACS analysis using wtIDH1 (n = 10) and muIDH1 (n = 6) human glioma tissues to quantify tumor-associated immune cells. Error bars show the standard error of mean (SEM). Analysis was done using Student's t-test. (C) Summary of the number of up-regulated and down-regulated genes between two glioma groups: wtIDH1 human low-grade gliomas (LGGs, black, n = 91), human muIDH1 astrocytomas (AS, red; n = 248), and human muIDH1 oligodendrogliomas (OD, blue; n = 169), (D) Summary of the number of gene ontology (GO) terms associated with up-regulated and down-regulated genes between two glioma groups. (E) Immune-related GO terms and corresponding P-values that are associated with the down-regulated genes in muIDH1 human gliomas.

