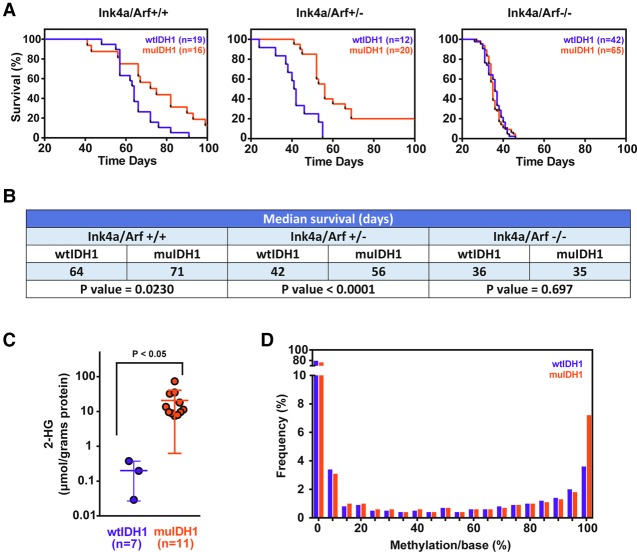
Figure 3.
muIDH1 mouse gliomas resembled muIDH1 human gliomas. (A) Survival plots of muIDH1 versus wtIDH1 mouse gliomas with different genomic backgrounds (Ntva_Ink4a/Arf+/+, Ntva_Ink4a/Arf+/−, and Ntva_Ink4a/Arf−/−) (Hambardzumyan et al. 2009). (B) Table showing median survivals and P-values. (C) 2-HG concentrations in murine gliomas. Metabolites from murine glioma tissues were extracted followed by DATAN derivatization. 2-HG was measured with liquid chromatography-mass spectrometry. Seven and 11 metabolite extracts were used for the wtIDH1 and muIDH1 mouse glioma groups, respectively. Error bars show the standard deviation (SD). Analysis was done using Student's t-test. (D) CpG island methylation analysis using reduced representation bisulfite sequencing (RRBS). n = 4 muIDH1; n = 2 wtIDH1.

