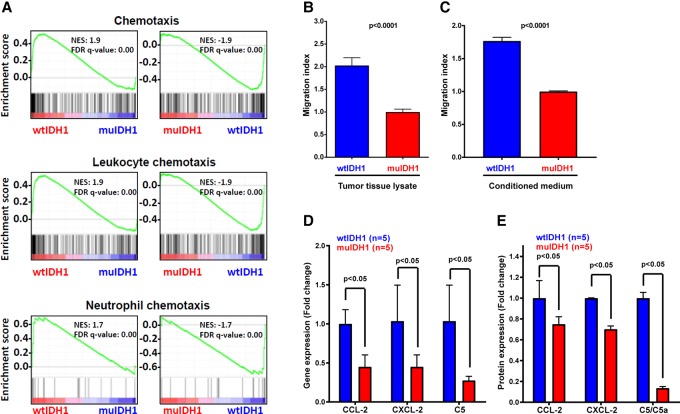
Figure 6.
Quantitative analysis of chemotaxis and chemokines. (A) GSEA plots showing that the gene expression of wtIDH1 mouse gliomas was positively associated with chemotaxis, leukocyte chemotaxis, and neutrophil chemotaxis, in contrast to muIDH1 mouse gliomas. (B) Migration index using wtIDH1 (n = 5) and muIDH1 (n = 9) tumor tissue lysates. (C) Migration index using conditioned medium from wtIDH1 (n = 5) and muIDH1 (n = 9) tumor-derived cells. (D) mRNA expression of CCL-2, CXCL-2, and C5 using quantitative PCR. (E) Protein expression of CCL-2, CXCL-2, and C5. Error bars show the SEM. Analysis was done using Student's t-test.

