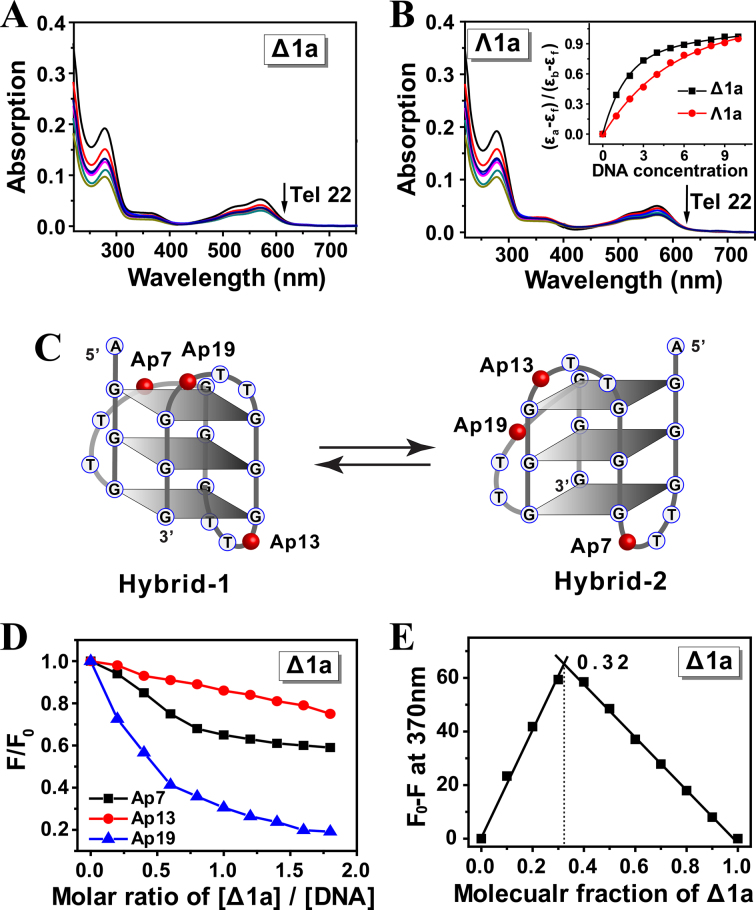
Figure 3.
Absorption spectra of Δ1a (A) and Λ1a (B) in the presence of Tel 22 DNA. Enantiomers was 5 μM, and Tel22 was varied from 0.5 to 10 μM. Arrow showed the absorption change of the enantiomer along with the addition of Tel22. Inset: plot of (εa-εf)/(εb-εf) versus concentration of Tel22. The assays were measured in 10 mM Tris buffer containing 10 mM KCl, pH = 7.2. (C) Schematic illustration of the individual 2-Ap position in Tel22 and the two types of Tel22 G-quadruplex conformations. (D) Plot of normalized fluorescence intensity at 370 nm of 2-Ap individually labeled Tel22 versus molar ratio of [Δ1a]/[DNA] in 10 mM KCl, 10 mM Tris buffer, pH = 7.2. 2-Ap labeled Tel22 was 0.5 μM in strand. (E) Job plot for complexation of Δ1a and Ap19-Tel22 in 10 mM KCl, 10 mM Tris buffer, pH = 7.2. [Δ1a]+[Ap19-Tel22] = 0.3 μM.

