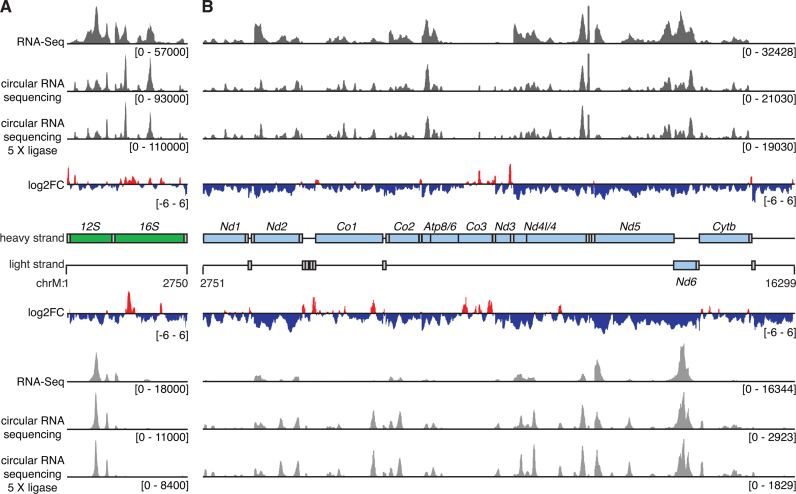
Figure 2.
Analysis of coverage from libraries produced by circularized RNA sequencing compared to standard RNA-Seq. The mitochondrial genome is separated into the region containing the rRNAs (A) and mRNAs (B). Coverage is shown in dark grey for heavy strand-encoded RNAs and in light gray for light strand-encoded transcripts. The ratio of coverage from circularized RNA sequencing compared to RNA-Seq is shown as log2 fold change with regions of increased coverage in red and decreased coverage in blue. The locations of genes are shown in a central schematic, where genes encoding rRNAs are shown in green, mRNAs are shown in light blue and tRNAs in gray. The ‘mt-’ prefix is omitted from each gene name for clarity.

