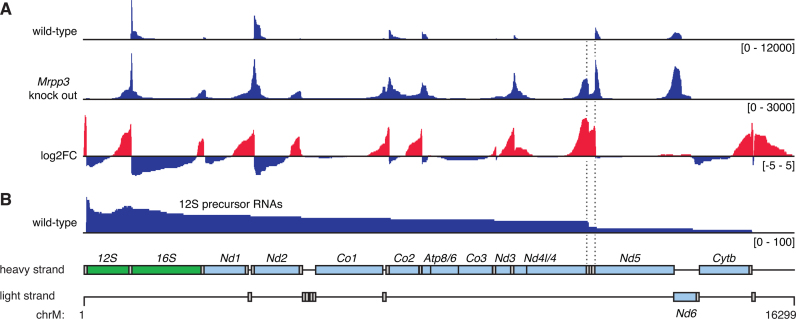
Figure 3.
Analysis of partially processed transcripts in libraries produced by circularized RNA sequencing. Abundance of reads which map between multiple genes are shown across the mitochondrial genome in both wild-type mouse mitochondria and Mrpp3 knock out mitochondria (A). A log2 fold change (log2FC) highlights partially processed regions that are enriched in the absence of MRPP3 with regions of increased coverage in red and decreased coverage in blue. Partially processed transcripts containing the 12S rRNA are shown in (B) and the region containing mt-Th, mt-Ts2 and mt-Tl2, is highlighted by dotted lines. The locations of genes are shown in a schematic, where genes encoding rRNAs are shown in green, mRNAs are shown in light blue and tRNAs in gray.

