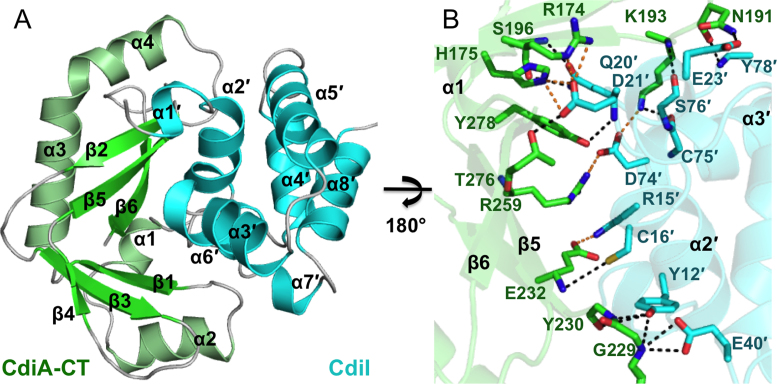
Figure 1.
Structure of CdiA-CT/CdiIYkris complex. (A) The CdiA-CT/CdiIYkris complex is depicted in ribbon representation. Secondary structure elements are indicated, with those of CdiIYkris denoted with a prime symbol (΄). (B) The CdiA-CT/CdiIYkris complex interface is mediated by an extensive network of ion pairs and H-bonds. Interacting residues are represented as sticks with oxygen, nitrogen, toxin carbon and immunity carbon atoms are colored red, blue, green and cyan, respectively. Electrostatics and H-bonds are represented by orange and black dashed lines, respectively.

