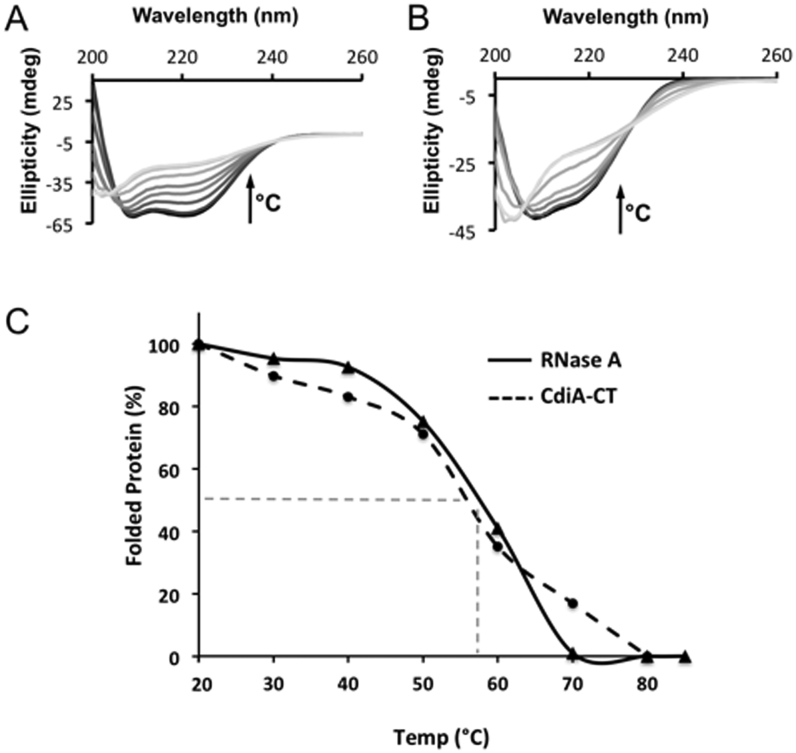
Figure 8.
Thermal stability of CdiA-CTYkris and RNase A. The secondary structure content of CdiA-CTYkris (A) and RNase A (B) was monitored by circular dichroism spectroscopy at temperatures between 20 and 90°C. Spectra colored in gray-scale progress from dark to light with increasing temperature. In both panels, the arrow represents the increase in temperature that correlates to a decrease of the spectral ellipticity (θ). (C) Comparison of CdiA-CTYkris and RNase A stability using global unfolding curves. The Tm for each protein is estimated to be the temperature at which there is 50% folded and unfolded protein (represented dashed grey line). All experiments were performed in triplicate.

