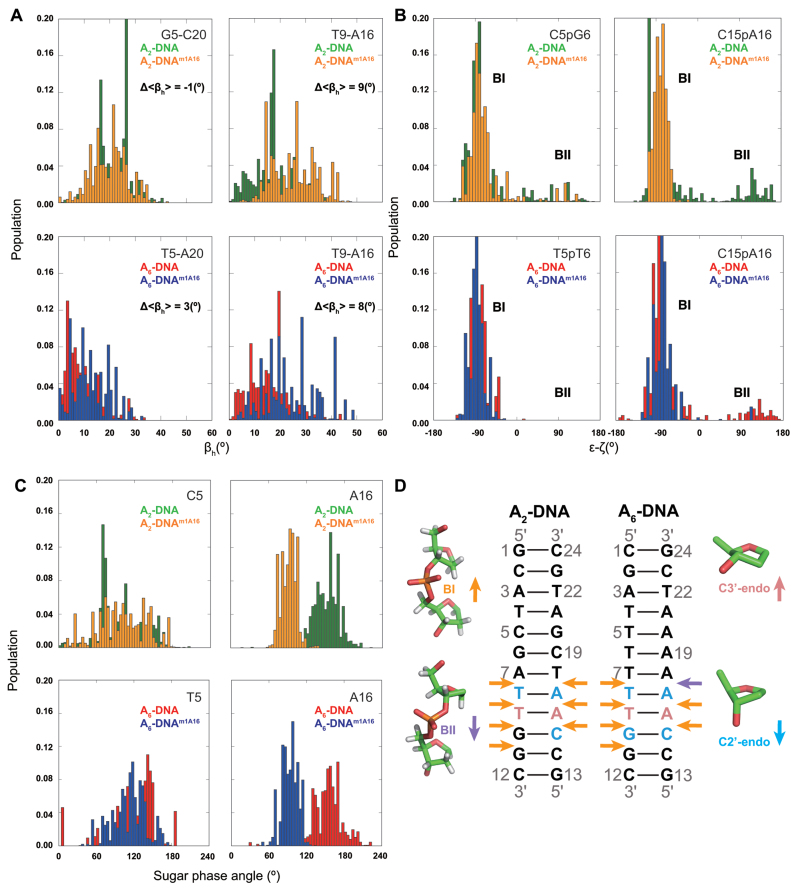
Figure 6.
(A) Ensemble distribution of local kink angle (βh) in the RDC-selected ensembles (N = 2400) at the m1A16•T9 HG and control C5–G20 (A2-DNA) and T5–A20 (A6-DNA) WC bp. Δ<βh> denotes the difference between the average kink angles. (B) Ensemble distribution of BI/BII population (ε-ζ) in the RDC-selected ensembles (N = 2400) at the C15pA16 and control C5pG6 (A2-DNA) and T5pT6 (A6-DNA). (C) Ensemble distribution of sugar phase angle in the RDC-selected ensembles (N = 2400) at the m1A16 and control C5 (A2-DNA) and T5 (A6-DNA). (D) Duplexes depicting m1A induced changes in ensemble distributions of sugar pucker toward C3΄-endo (pink) or C2΄-endo (light blue), and backbone torsion angles toward BI (orange) or BII (purple) in A2- and A6-DNA as inferred from ensemble, structure and other NMR data.

