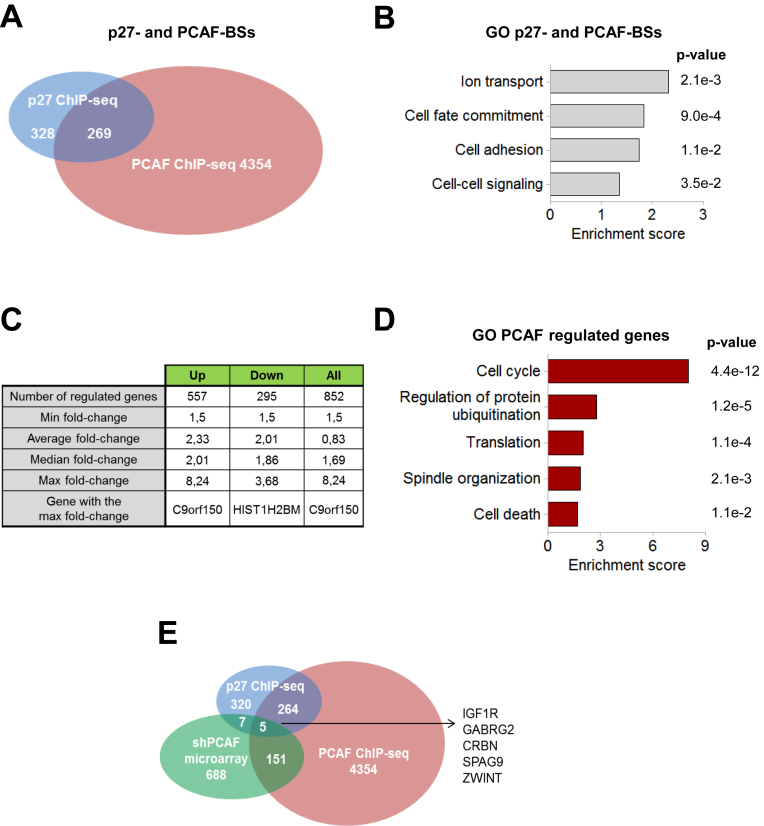
Figure 3.
Identification of genes putatively regulated by p27 and PCAF. (A) Venn diagram representing the number of genes encoding for proteins identified by ChIP-seq with anti-PCAF antibodies (pink) or with anti-p27 (blue). (B) The biological processes enriched in the group of genes sharing p27 and PCAF-BSs (269 genes) were identified by using the DAVID program. (C) Number of genes differentially expressed in PCAF-KD versus control HCT116 cells identified by expression microarray analysis and main characteristics of the data. (D) The biological processes enriched in the group of genes differentially expressed in PCAF-KD cells versus control were identified using the DAVID program. (E) Venn diagram representing the number of genes encoding for proteins identified by ChIP-seq with anti-PCAF antibodies (pink), with anti-p27 (blue) or differentially expressed in PCAF-KD cells (green).

