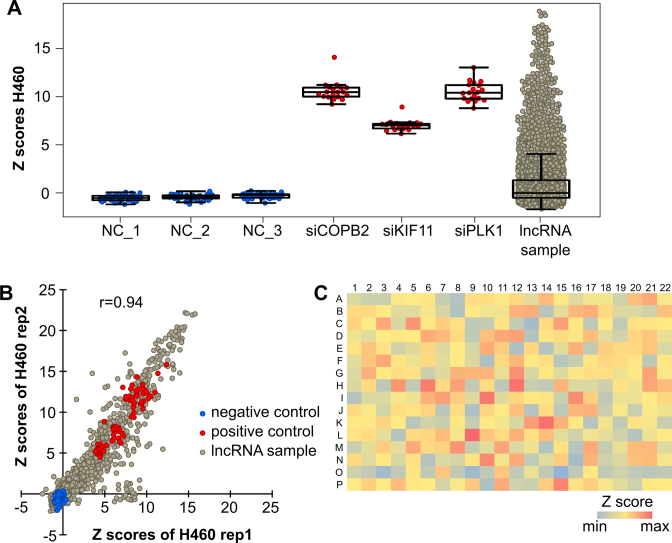
Figure 1.
Quality assessment of siRNA screens addressing viability of H460 cells. H460 cells were screened for cell viability 72 h after transfection (n = 2). Raw values were normalized to the plate median and Z scores were calculated for each reaction. Replicates were summarized by averaging the Z scores. (A) Boxplots with summarized Z scores of the negative controls (blue), the respective positive controls (red) and siRNAs targeting lncRNAs (gray). (B) Z scores of the two replicates were plotted against each other. R indicates the Pearson correlation coefficient. (C) Image plot of summarized Z scores that were averaged over each well position of the nine screening plates. Red indicates the maximum value, blue the minimum value. Positive and negative controls were excluded for this analysis and were not depicted on the plot.

