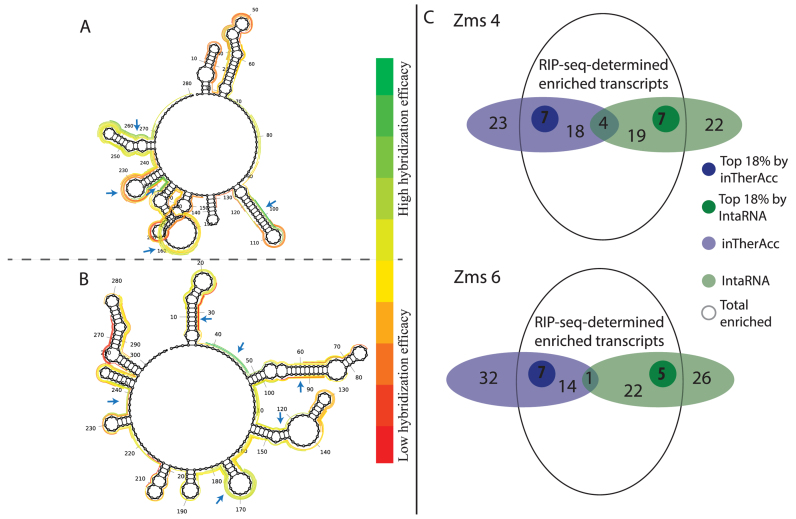
Figure 8.
inTherAcc aids in prediction of mRNA targets for Z. mobilis (A) Zms4 and (B) Zms6. Ten regions evenly distributed at the top (green) and bottom (red) of the hybridization efficacy scale were selected as potential mRNA–sRNA binding sites for further prediction of target mRNA candidates and comparison with RIP-seq data. The regions that matched with the 18% of top enriched candidates (log2 of fold change sRNA/only MS2) are marked with blue arrows. (C) Overview of the prediction performance for IntaRNA (green) and inTherAcc (blue). Venn diagram showing the total enriched candidates (log2(sRNA/only MS2) > 0). A total of 52 and 54 candidates respectively for Zms4 and Zms6 were predicted using both approaches. Darker green and darker blue circles represent the top 18% enriched candidates that each approach predicted correctly.

