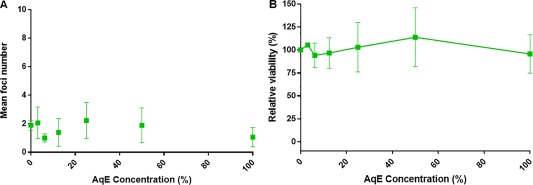
Figure 5.

Results from the Bhas promoter cell transformation assay (A) and parallel cell growth assay (B) following ePen e‐cigarette AqE treatment. Data are represented as the mean ± standard deviation of three independent experiments. Six wells were used for each treatment group in the promotion assay and three wells per treatment for the cell growth assay.
