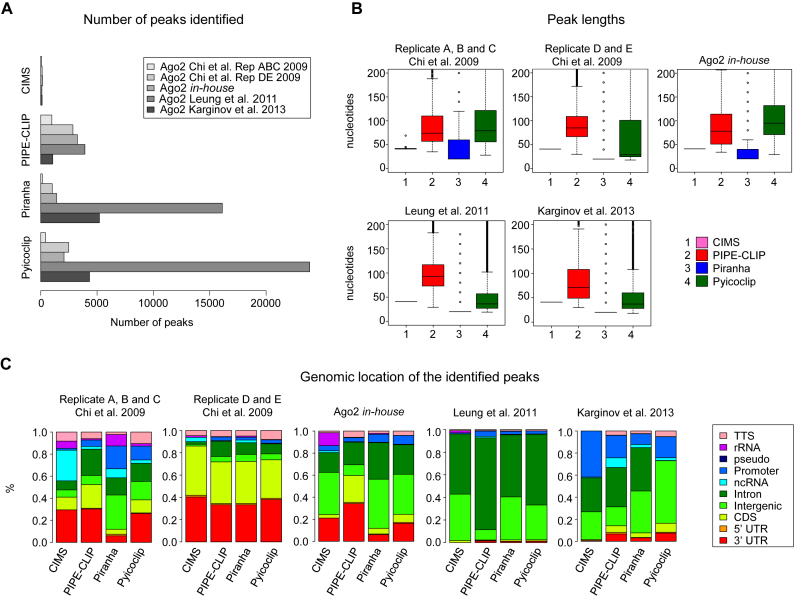
Figure 1.
General features of the peaks identified by the four indicated programs for the indicated Ago2 HITS-CLIP datasets. (A) Total number of peaks identified. (B) Boxplots of the peak lengths found. (C) Genomic location of the identified peaks. Color code is indicated. 3΄UTR (3΄ untranslated region), 5΄UTR (5΄ untranslated region), CDS (protein coding sequence), pseudo (pseudogene), rRNA (ribosomal RNA), TTS (terminal transcription site).

