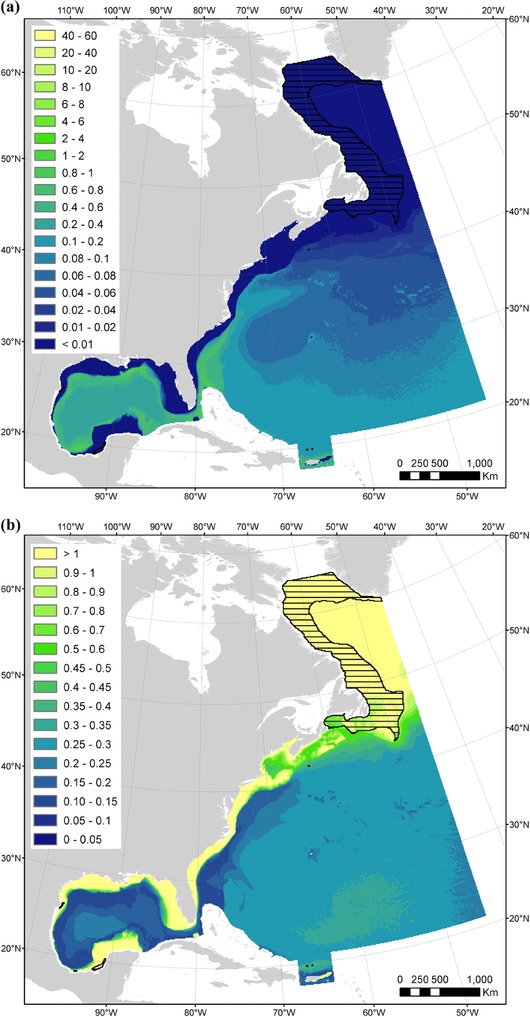
Figure 3.

Maps of (a) mean year‐round predicted densities (individuals per 100 km2) and (b) mean year‐round coefficients of variation from the spatial part of the density model for Kogia spp. (black horizontal lines, extrapolations beyond the predictor ranges [these predicted densities should be considered with extreme caution]). An Albers equal area projection is used for the study area.
