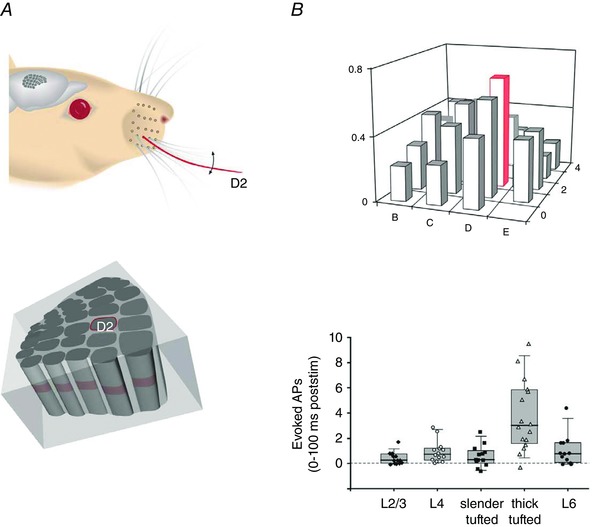
Figure 12. Output receptive fields of L5tt cells and the total L5tt AP output.

A, whisker system, viewing the right facial whisker pad. Upper panel, deflection of the D2 whisker. Lower panel, tissue block with columns illustrating the location of the D2 column (caudal–rostral view, looking onto the arc of ‘greek’ whisker columns α, β, γ and δ, respectively). The E‐row columns are located on the right side of the tissue block. B, AP‐RF and total spike output. Upper panel, bar histogram of output AP‐RF map of L5tt cells. Responses of arc of greek columns in front to match the pseudo‐3D view onto the arc of greek columns as shown in A (lower panel). The response of the L5tt cell located in the D2 column (red outline) is maximal when the D2 whisker is deflected (red). The RF map is broad and shallow. Ordinate indicates probability of occurrence of evoked AP response. Lower panel, average whisker‐evoked AP output of a column is dominated by L5tt pyramid cells. From DeKock et al. (2007), with permission.
