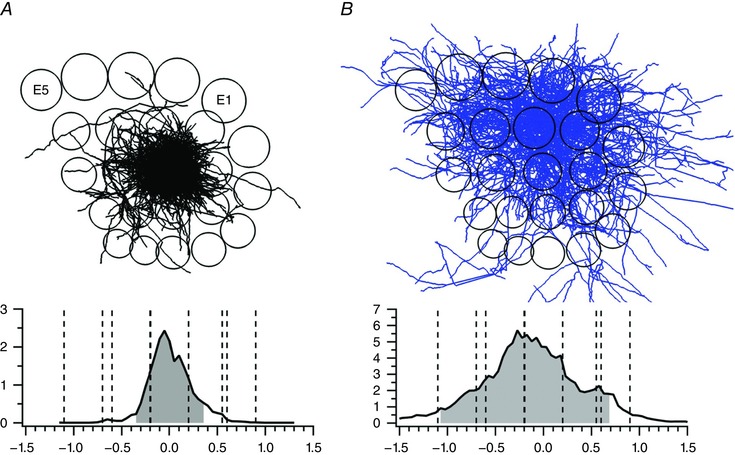
Figure 15. Tangential view of VPM cell and L6 cell axons in deep cortical layers projected onto a tangential column pattern of vS1.

A, VPM axons. Upper panel, projection of axons (black) on tangential plane superimposed onto column pattern (circles) of left vS1. Top, E‐row columns. Columns E1 and E5 are labelled. Lower panel, one‐dimensional (1D) axon‐density profile along a row. The ordinate specifies the axon length density in millimetres per 50 μm bin. The abscissa specifies the distance from the PW centre along the row (in millimetres). Dashed lines indicate the borders of the PW column and adjacent SuW columns, respectively. Grey area denotes 90% axon density. B, L6cc cell axons. Upper panel, projection of axons (blue) on tangential plane superimposed onto column pattern (circles), as in A. Lower panel, 1D axon‐density profile along a row, as in A. Note broader and denser projections into surround columns compared with A. From Narayanan et al. (2015), with permission.
